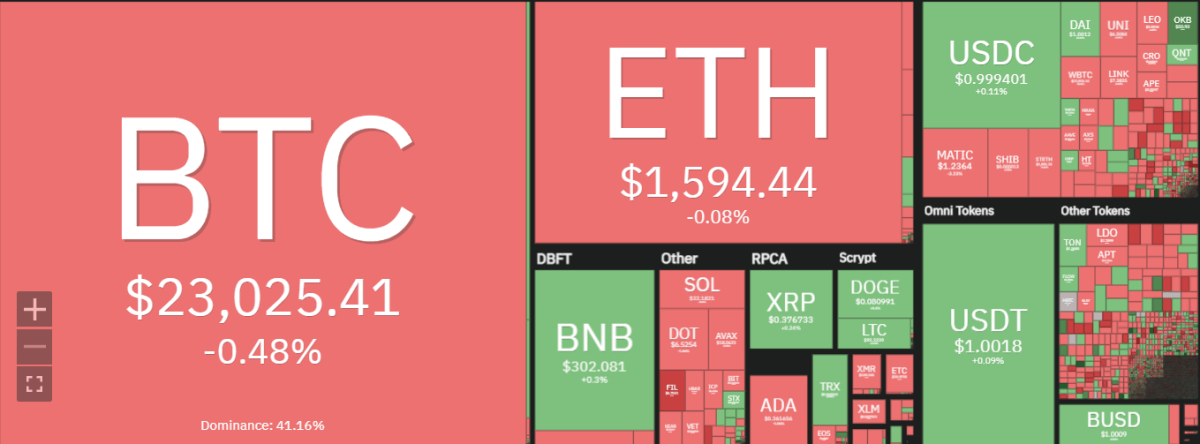
Son Bitcoin fiyatı analysis reveals the bears are leading the price chart for the day, and the cryptocurrency value has been drastically reduced. The bearish wave has been ongoing for the past two days, and the price has been constantly declining. The price has undergone devaluation in the last 24 hours as well because the bearish trend is getting stronger. The price is now at $23,047 and a further decrease can be expected if the bears continue to lead in the future.

The current support level is at $22,906 which indicates that the bulls are trying to resist the downward pressure of the bearish wave. However, the bulls may make a comeback if the support level holds. The resistance level is at $23,289 and any break of this level will be seen as a positive sign for the bulls.
The current trading volume of BTC/USD is $17 billion and it has been decreasing for the last 24 hours. The market cap of the cryptocurrency is currently at $444 billion.
BTC/USD 1-day price chart: Further downflow expected as the bearish trend intensifies
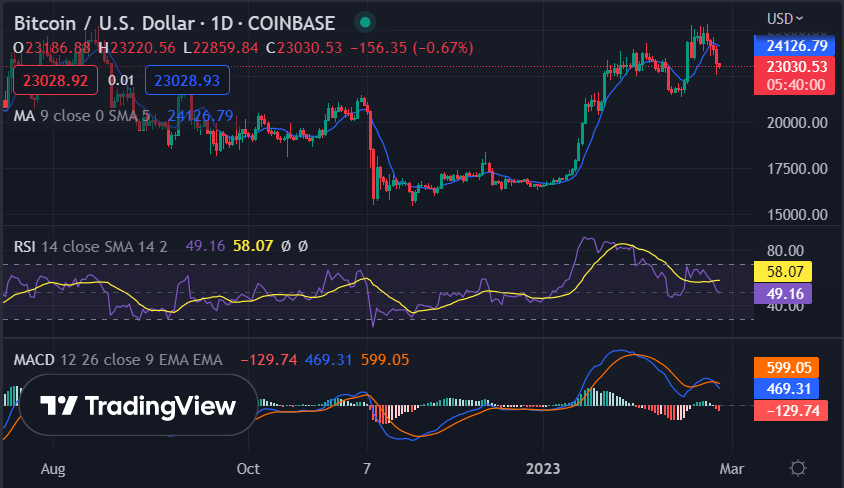
The one-day Bitcoin price analysis is dictating a rise in the bearish momentum during the day. The price has dropped down to alarming levels as the bears have been maintaining their lead quite efficiently. The price has declined up to the $23,047 mark today, and a further downfall in BTC/USD value can be highly expected.

Furthermore, the moving average (MA) value for the cryptocurrency is relatively high, which is a sign of bearish sentiment in the market. The MA value for Bitcoin is currently at $24,126, and any break above this level may induce an uptrend. Looking at the MACD indicators, the bearish divergence is increasing as the MACD line, and the signal line is both in the negative zone. The relative strength index (RSI) is also in the oversold region, implying that the bears are in control of the market.
Bitcoin price analysis: BTC trades in the $23,000 range as the bear market persists
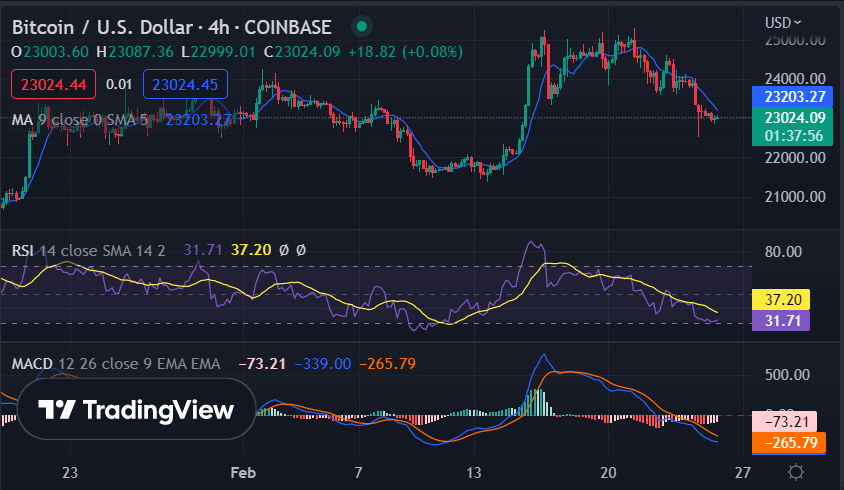
The 4-hours Bitcoin price analysis is supportive for the bears as well, as the price has downgraded to $23,047 according to the latest update. The past week’s price action has been showing mixed results, yet today the trends have reversed in favor of the bears.

The moving average is quite above the price value and is at $23,203, with the 50-day MA and 200-day MA both in the negative zone. The MACD and the signal line are decreasing and intersecting and also showing signs of a negative crossover, which also supports the bearish sentiment. Lastly, the RSI is in oversold territory and any rise above this level will be seen as a positive sign for the bulls.
Bitcoin fiyat analizi sonucu
To sum up, the Bitcoin price analysis shows that bearish sentiment is prevailing in the market. The bears are dominating as of now, and any break above $23,289 may induce an uptrend. The support level is still at the 22,906 mark while further downflow can be expected in case of a negative crossover.
Bitcoin'in daha fazla ilerlemesini beklerken, Fiyat Tahminlerimize bakın. XDC, Polkadot, ve eğri
Kaynak: https://www.cryptopolitan.com/bitcoin-price-analysis-2023-02-25/
