Up until now, ETH has managed to remain above $1,200 despite the increased selling pressure, but the price clearly shows that the downward trend is weakening after the Merge. However, this doesn’t mean that bullish momentum is underway.
Teknik Analiz
By Bozayı
Günlük Grafik
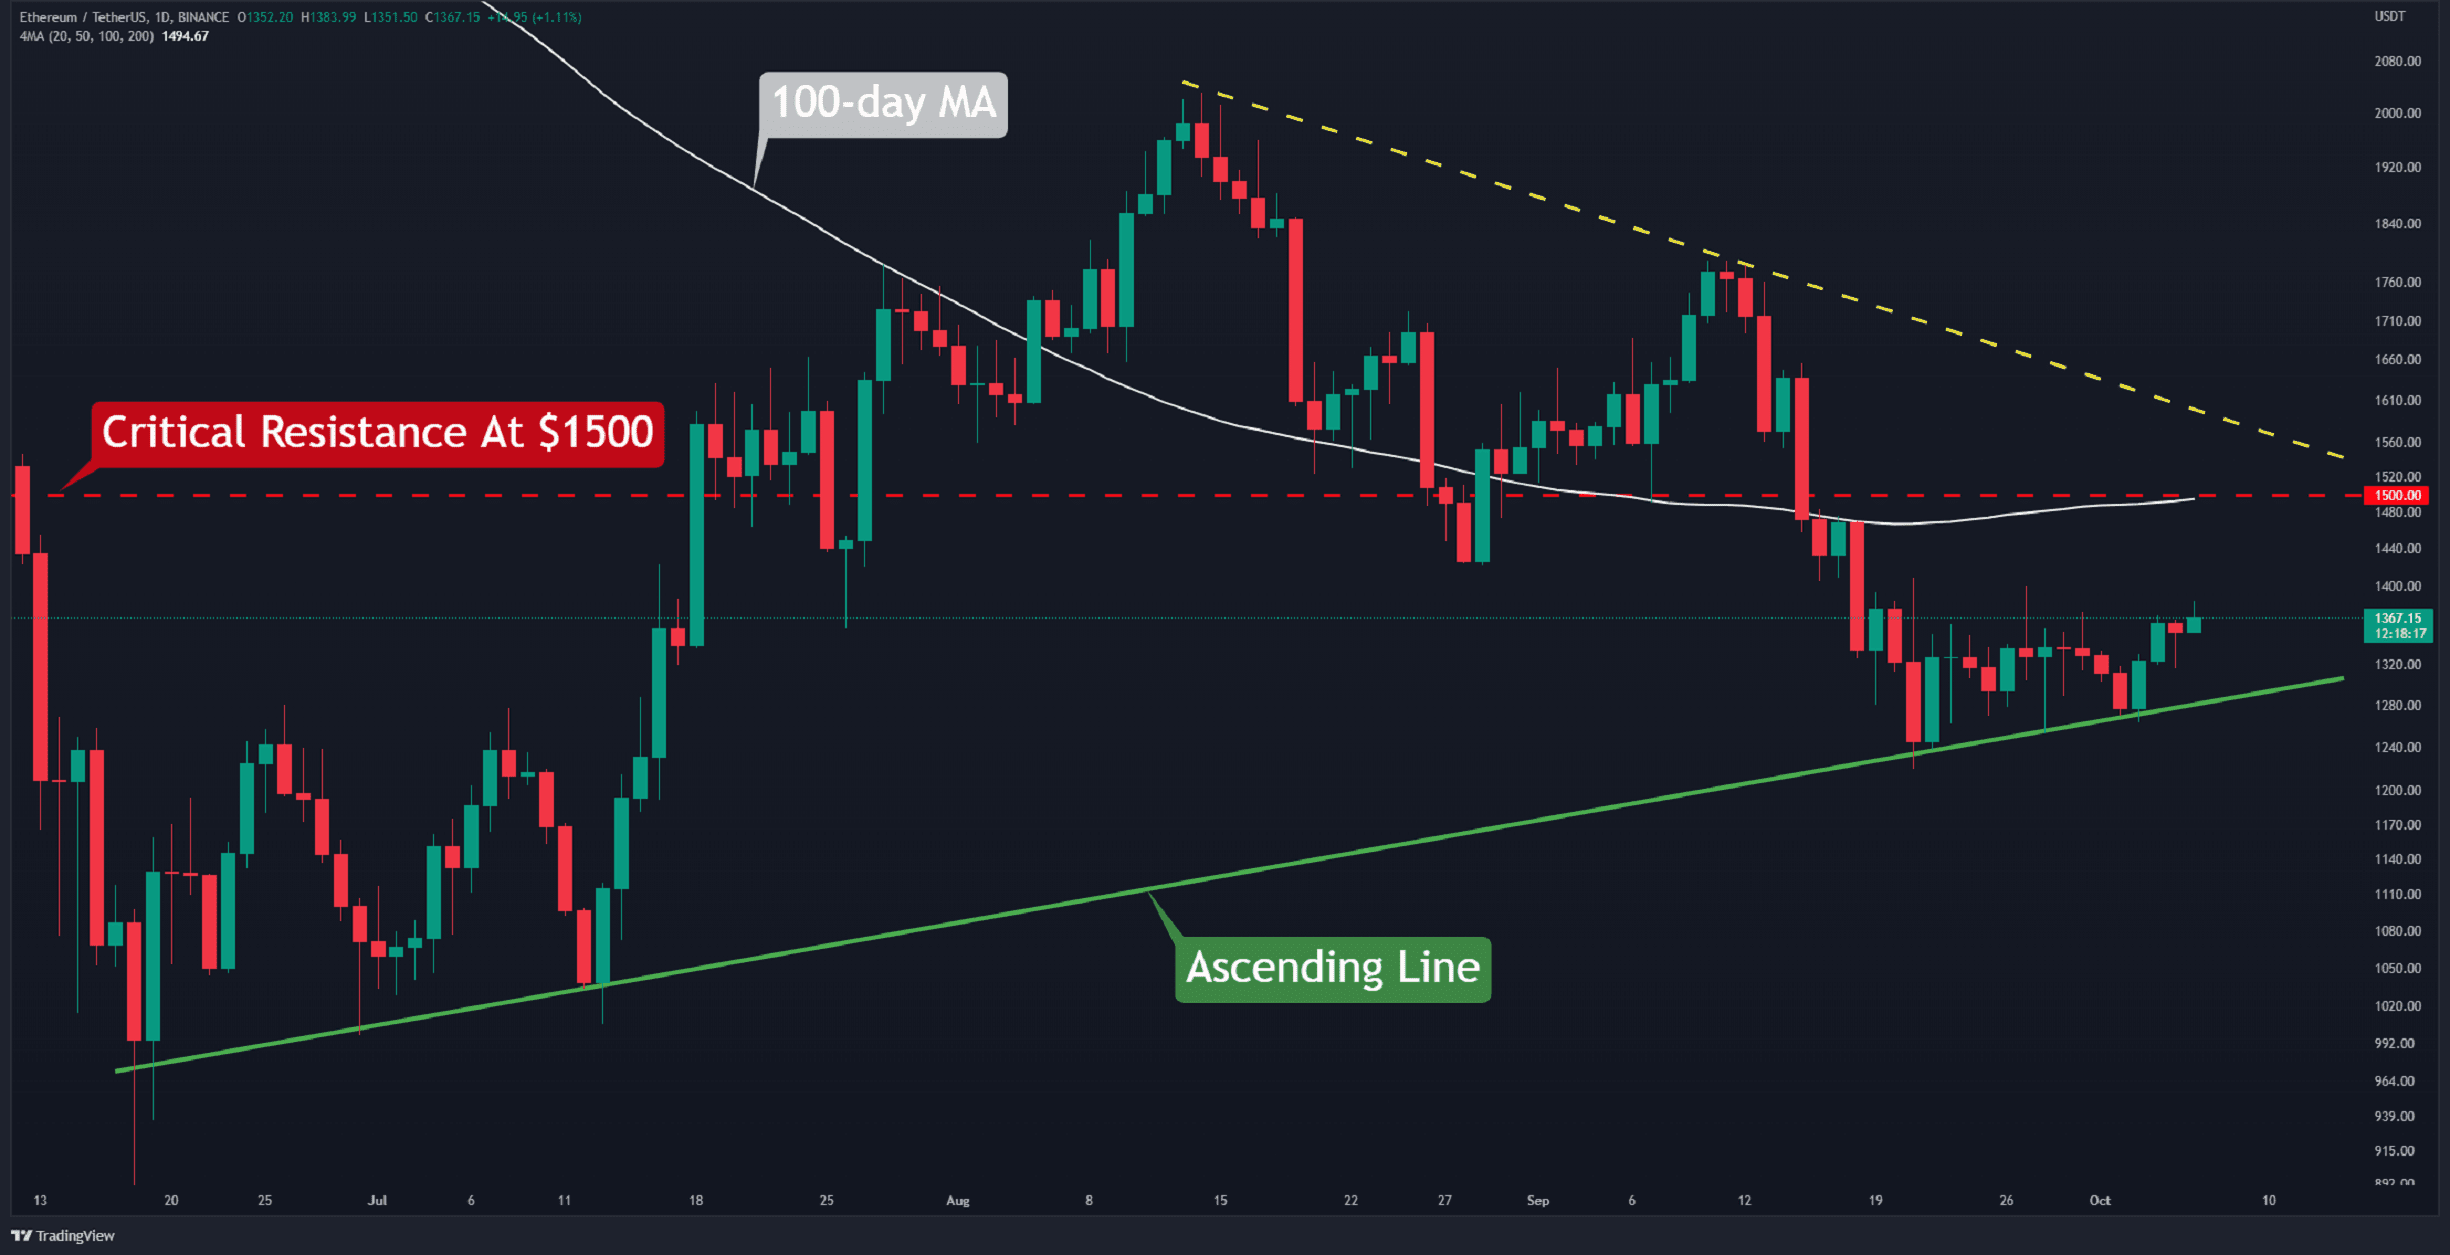
ETH was supported by the ascending line (in green) again, and increased investor confidence prevented the price from closing below it. The chart currently shows no notable signs of bullish momentum as the sideways trend continues for a second week.
The first obstacle is to break $1,500. (in red). This resistance results from the descending line (in yellow) and the 100-day moving average line (in white) colliding. If the ETH can clear this hurdle, the path to $2000 will be clearer.
As long as Ethereum trades below $1,500, a retest of the green support is not ruled out. Closing below this level may take the asset to the next support level at $1,000.

Temel Destek Seviyeleri: 1240 ABD Doları ve 1000 ABD Doları
Anahtar Direnç Seviyeleri: 1500 ABD Doları ve 1800 ABD Doları
Günlük Hareketli Ortalamalar:
MA20: 1333 $
MA50: 1497 $
MA100: 1494 $
MA200: 1921 $
ETH/BTC Grafiği
Against Bitcoin, the bears seem to be expanding the momentum, resulting in an 18% correction following the Merge.
This trend is likely to continue toward the horizontal level at 0.065 BTC (in green), which appears to be solid support. To even consider some sort of bullishness, the price would first have to start charting higher highs and higher lows.
Temel Destek Seviyeleri: 0.065 & 0.06 BTC
Anahtar Direnç Seviyeleri: 0.073 & 0.08 BTC

Duygu Analizi
Finansman Oranları
Tanım: Kalıcı sözleşme piyasaları ile spot fiyatlar arasındaki farka bağlı olarak yatırımcılara uzun veya kısa süreli periyodik ödemeler.
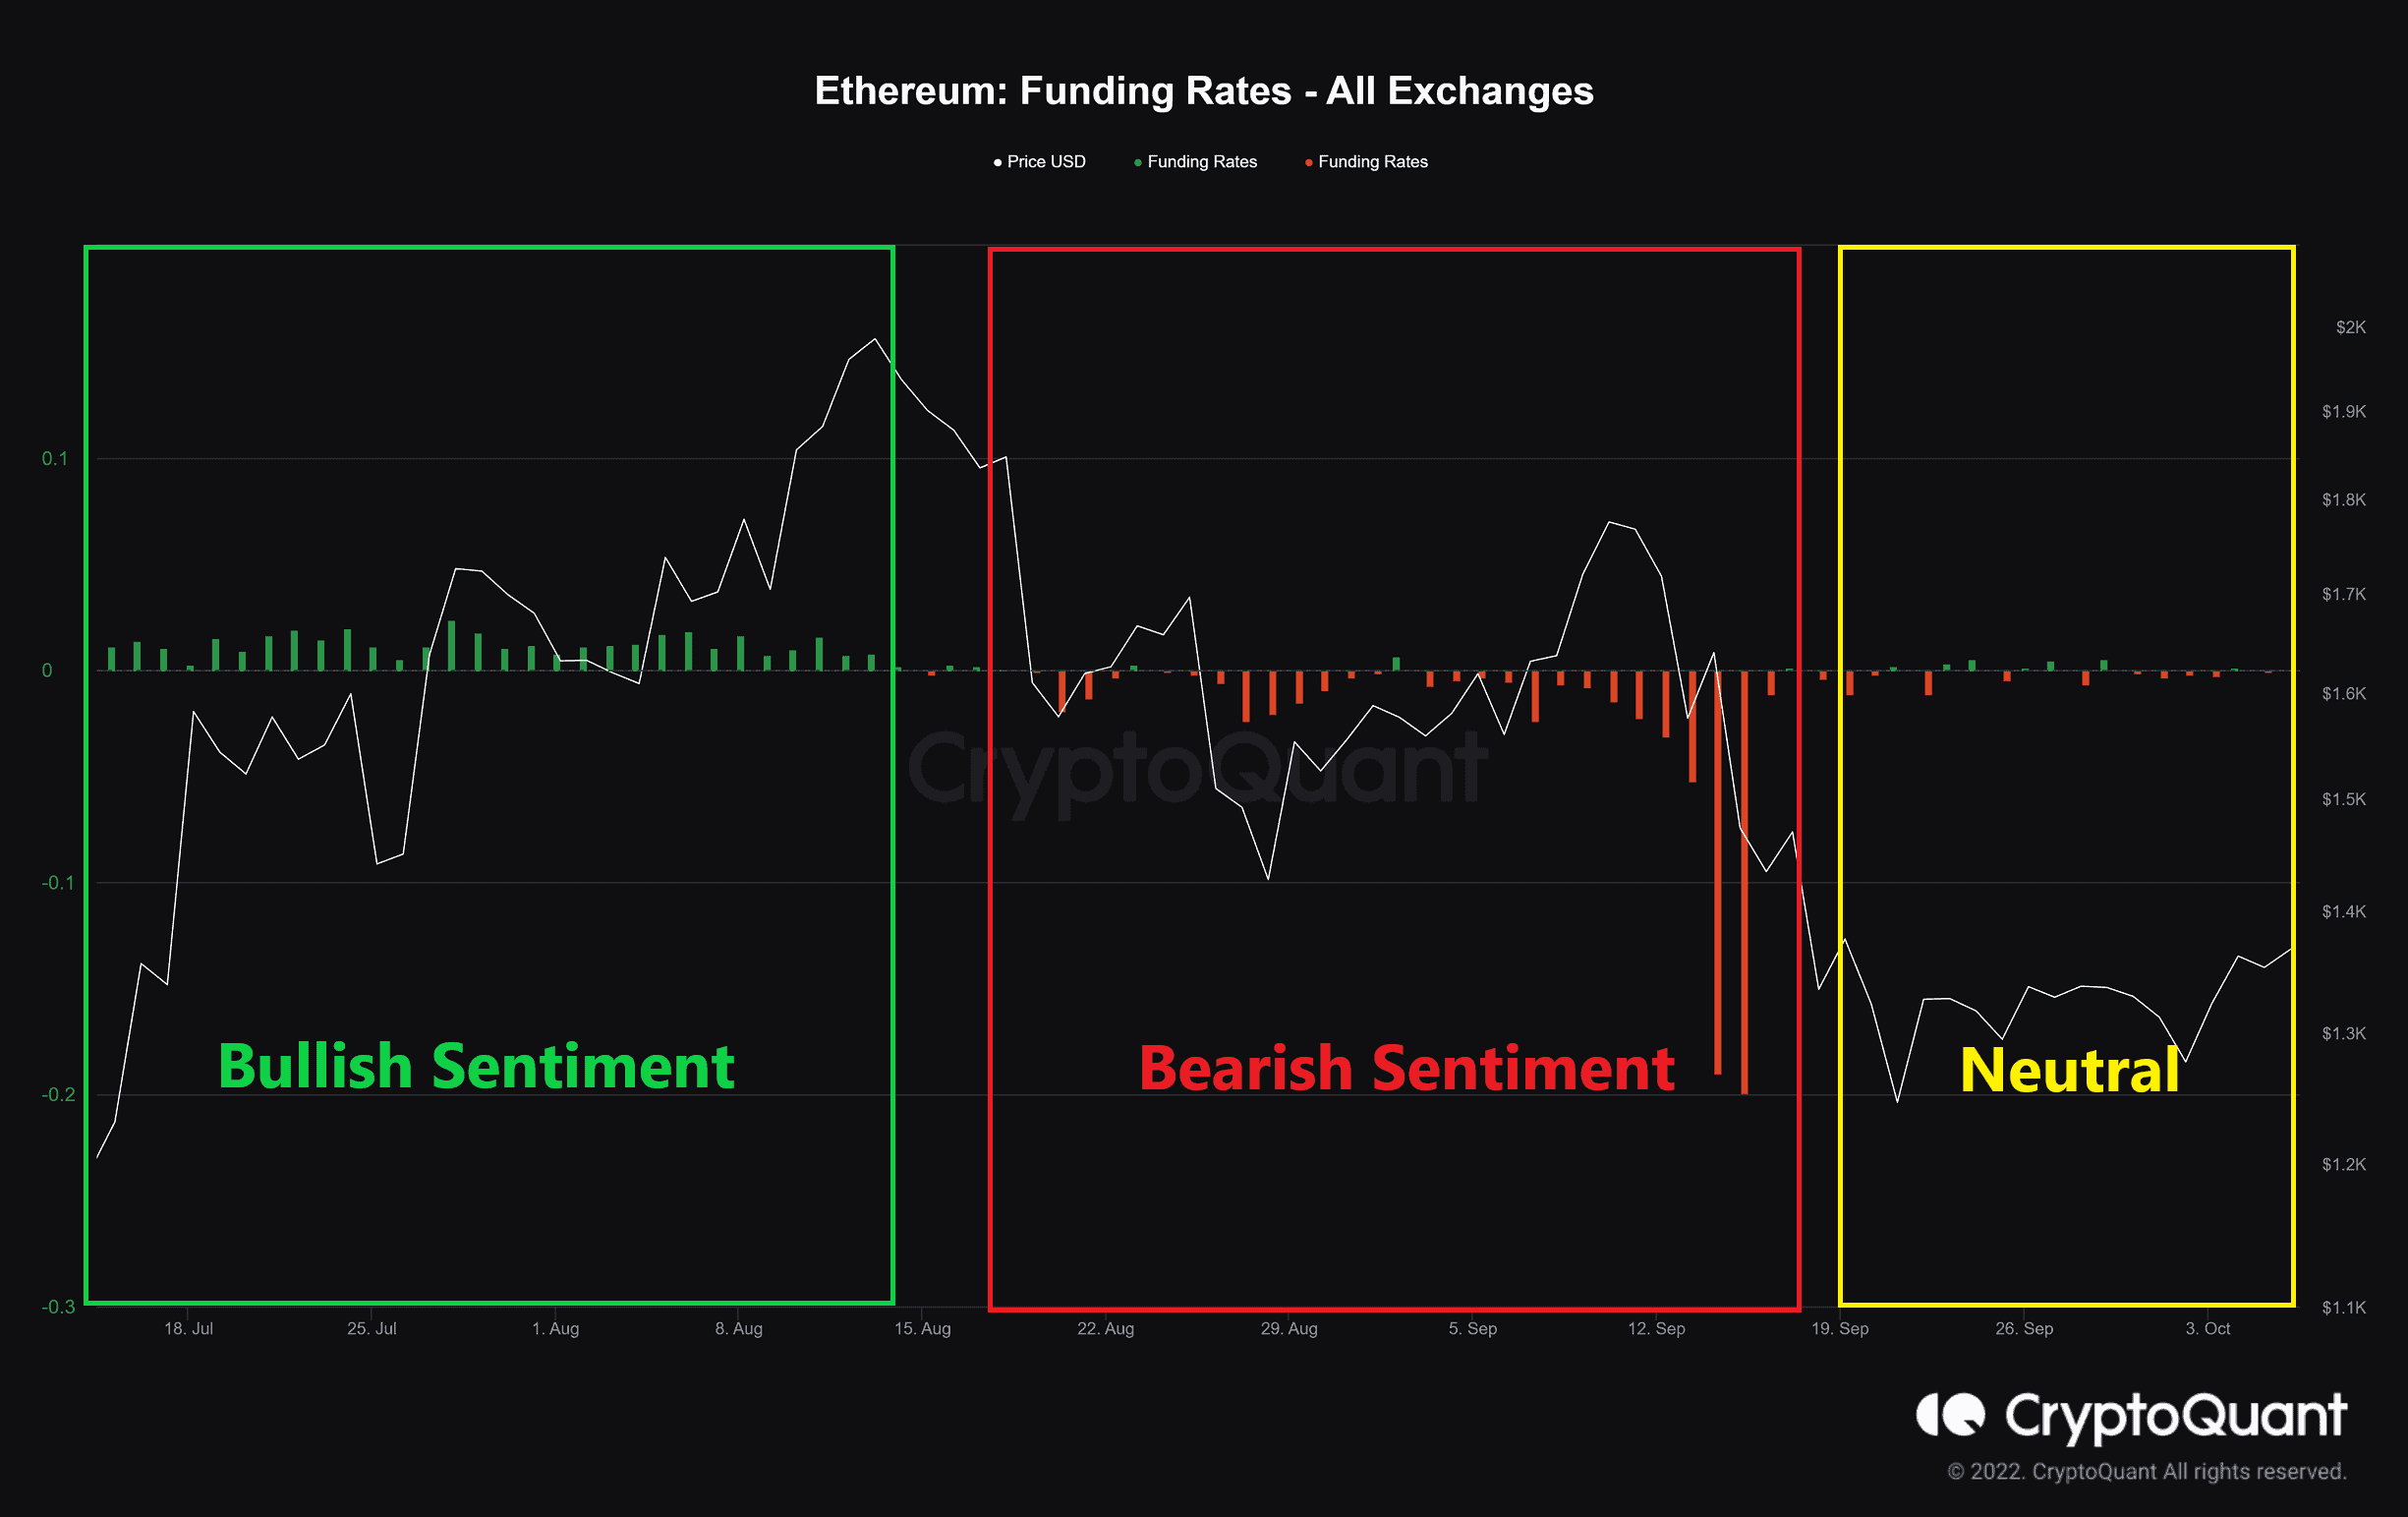
Funding rates represent traders’ sentiments in the perpetual swaps market, and the amount is proportional to the number of contracts. Positive funding rates indicate that long positions are dominant and are willing to pay funding to short traders.
According to CryptoQuant data, there is still uncertainty among investors and traders in the derivative market. This overall doubt contributed to the establishment of the sideways trend stated in the technical analysis.
Bullish and bearish momentum rises when market sentiments, particularly in derivatives, align with the trend’s direction. Presently, this behavior is not visible.
Binance Ücretsiz 100$ (Özel): Bu bağlantıyı kullan kayıt olmak ve ilk ay Binance Vadeli İşlemlerinde 100$ ücretsiz ve %10 indirimli ücret almak için (şartlar).
PrimeXBT Özel Teklifi: Bu bağlantıyı kullan Kaydolmak ve depozitolarınızdan 50$'a kadar almak için POTATO7,000 kodunu girmek için.
Feragatname: CryptoPotato'da bulunan bilgiler alıntılanan yazarlara aittir. CryptoPotato'nun herhangi bir yatırım alıp satmayacağı veya satmayacağı hakkındaki görüşlerini temsil etmez. Herhangi bir yatırım kararı vermeden önce kendi araştırmanızı yapmanız tavsiye edilir. Verilen bilgileri kullanmak kendi sorumluluğunuzdadır. Daha fazla bilgi için Sorumluluk Reddi Beyanı'na bakın.
Kripto para grafikleri TradingView tarafından.
Source: https://cryptopotato.com/eth-price-unable-to-break-rrange-but-can-bulls-extend-to-1400-etherum-price-analysis/