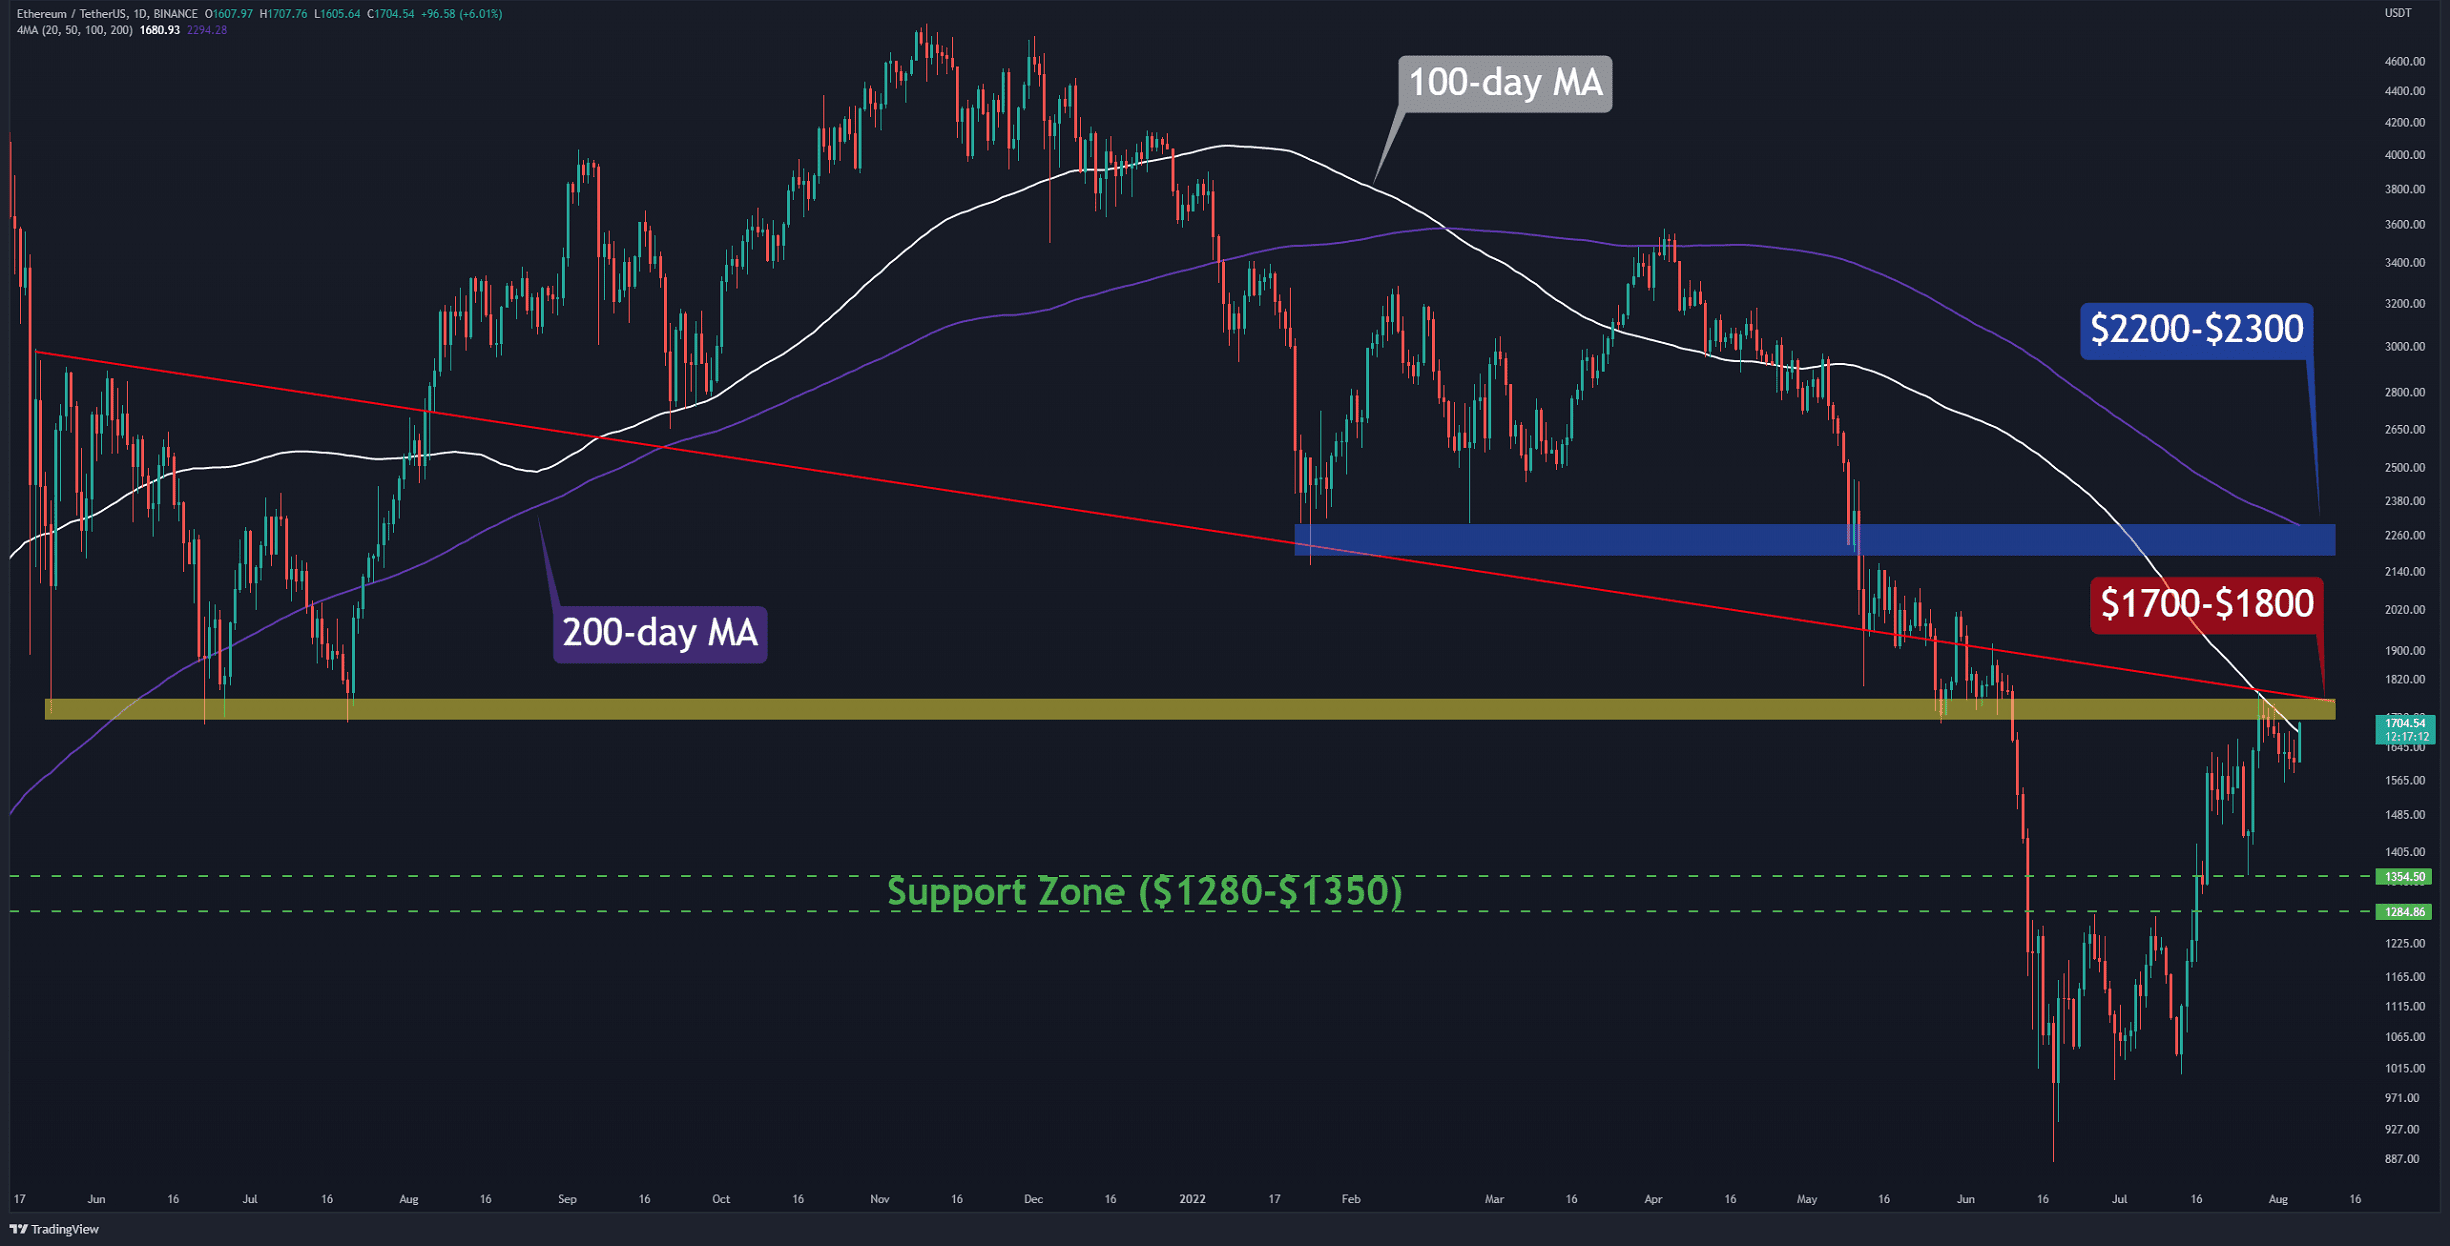
It appears that Ethereum failed at yet another attempt to convincingly overcome $1,700, showing that the buying pressure is slowly fading. The question is if the momentum will pick up or if the bears will take the opportunity to bring the price lower.
Teknik Analiz
By Bozayı
Günlük Grafik
The daily chart shows that the firm resistance in the $1,700-$1,800 range is far from over. This resistance zone, which includes the 100-day moving average (in white), is considered the main obstacle for bulls on the way to $2000. A break and close above it would signal the start of a new uptrend with a target of $2,200 (in blue), which overlaps with the 200-day moving average (in purple).
Countering this assumption, if the demand in this area dries up and the bears dominate the market again, the possible decline can extend to the support zone in the range of $1,280-1,350 (in green).

Currently, the structure has not changed, and until the lower highs and lower lows are formed, the bullish sentiment prevails.
Temel Destek Seviyeleri: 1500 ABD Doları ve 1350 ABD Doları
Anahtar Direnç Seviyeleri: 1800 ABD Doları ve 2200 ABD Doları
Günlük Hareketli Ortalamalar
MA20: 1589 $
MA50: 1323 $
MA100: 1681 $
MA200: 2294 $
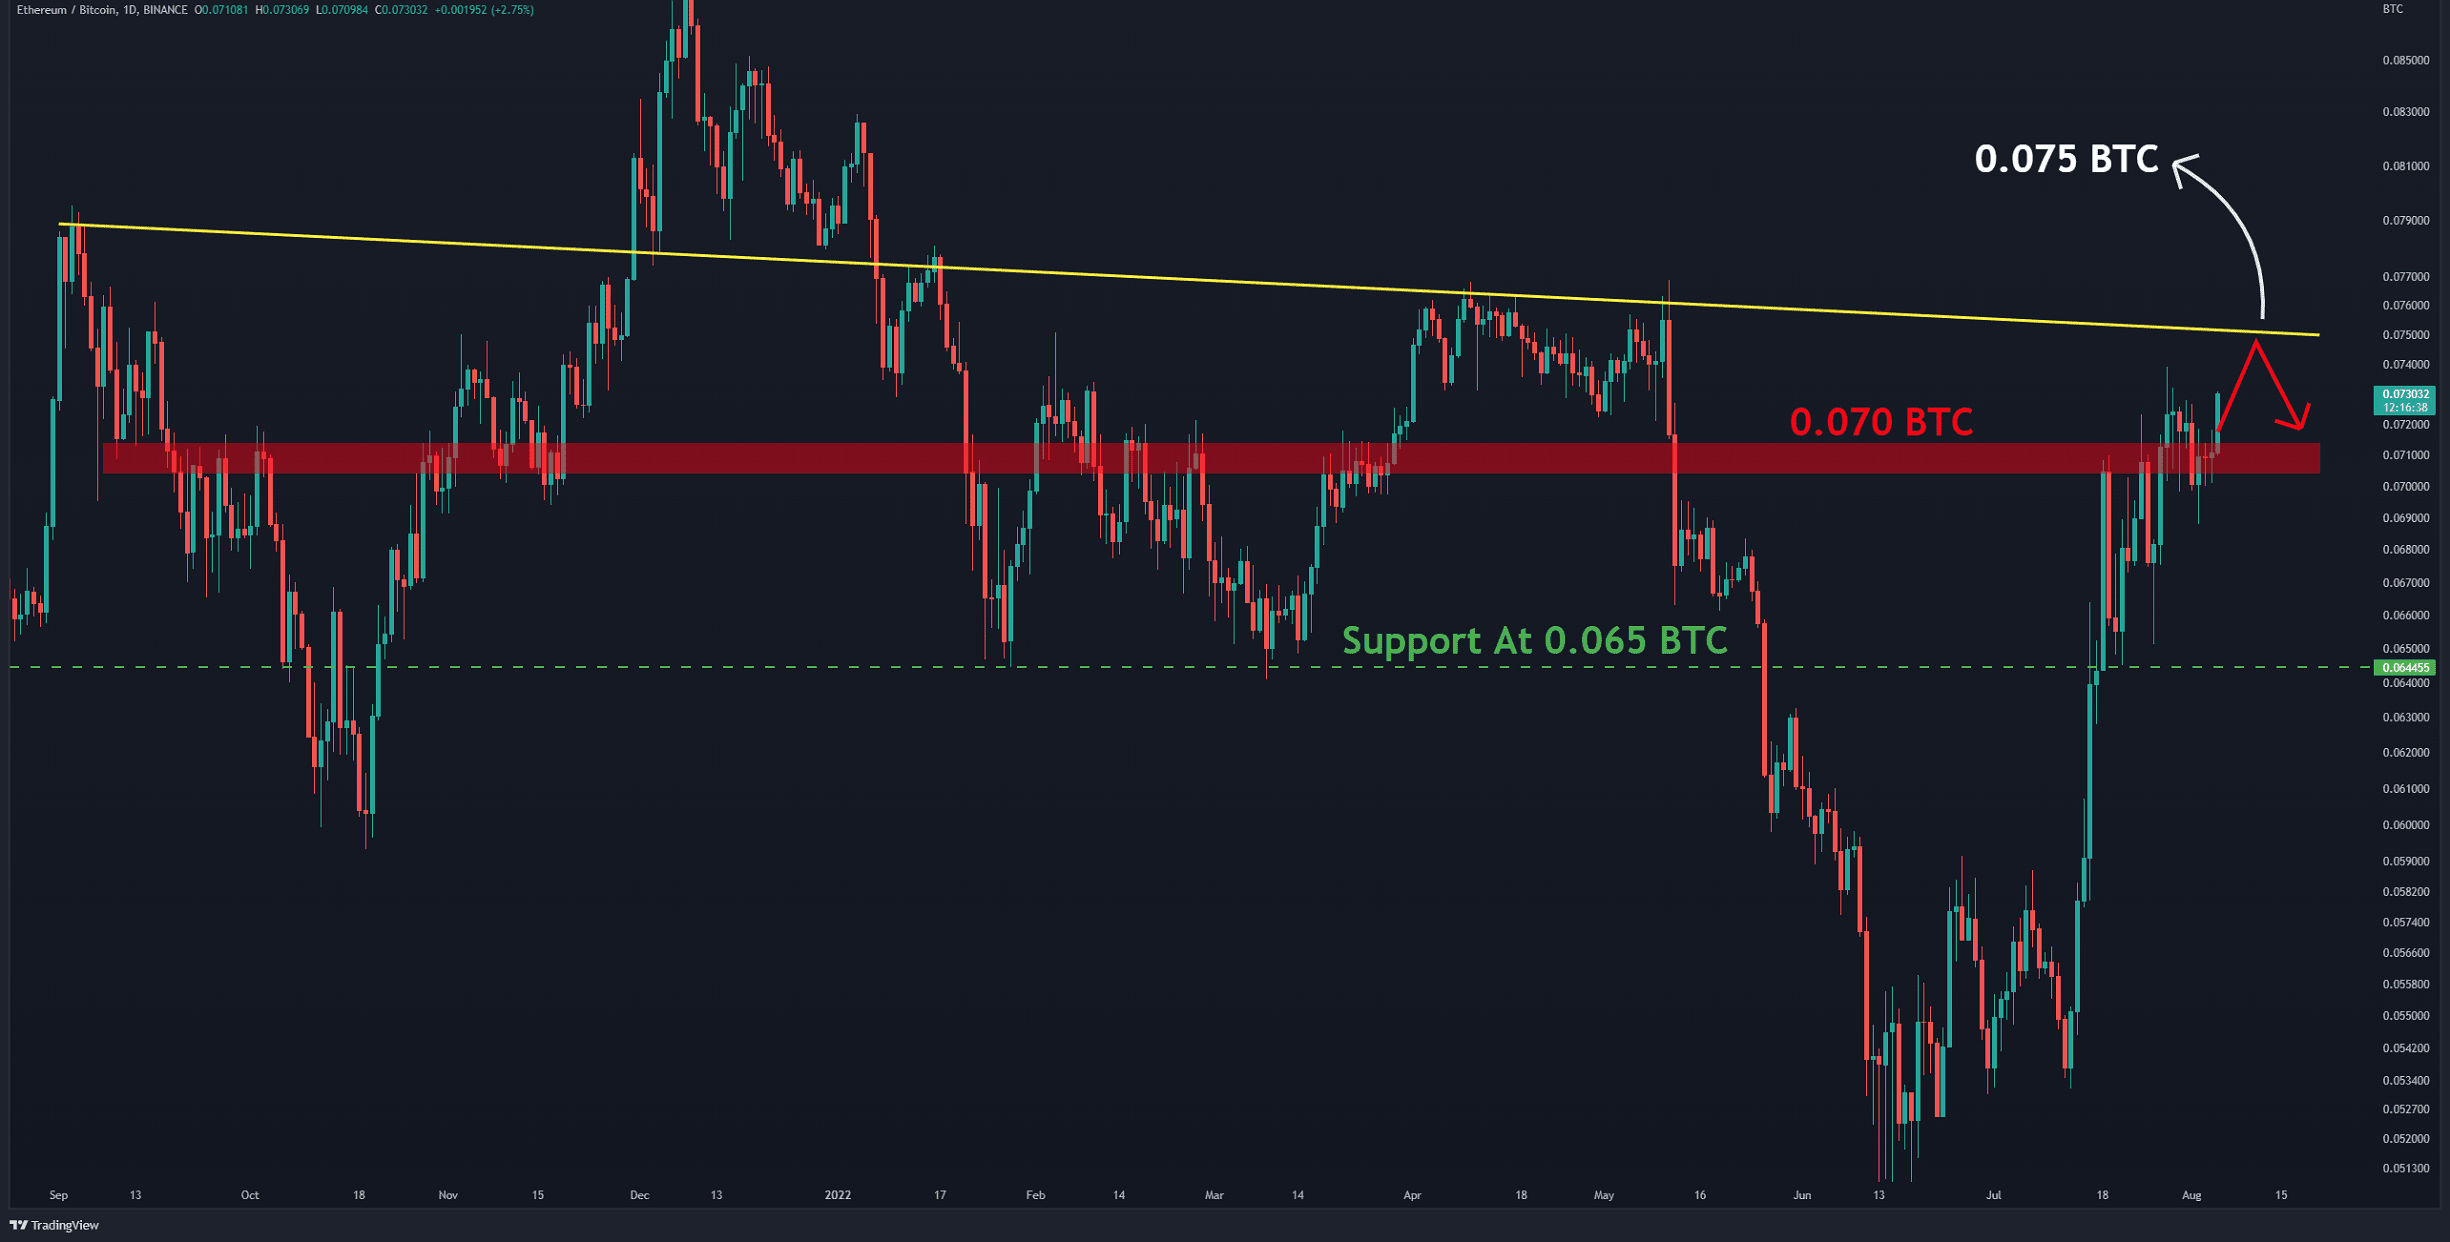
ETH/BTC Grafiği
Against Bitcoin, the buyers dominate the market completely. All corrective attempts on the lower time frames are absorbed quickly. The bulls are trying to sustain the price above 0.07 BTC (in red). At this point, it seems more likely that the resistance at 0.75 BTC will be tested. This is where the bears might stage a reappearance. The bullish trend would remain strong as long as ETH is trading above horizontal support at 0.065 BTC (in green).
Temel Destek Seviyeleri: 0.065 & 0.06 BTC
Anahtar Direnç Seviyeleri: 0.073 & 0.075 BTC
Duygu Analizi
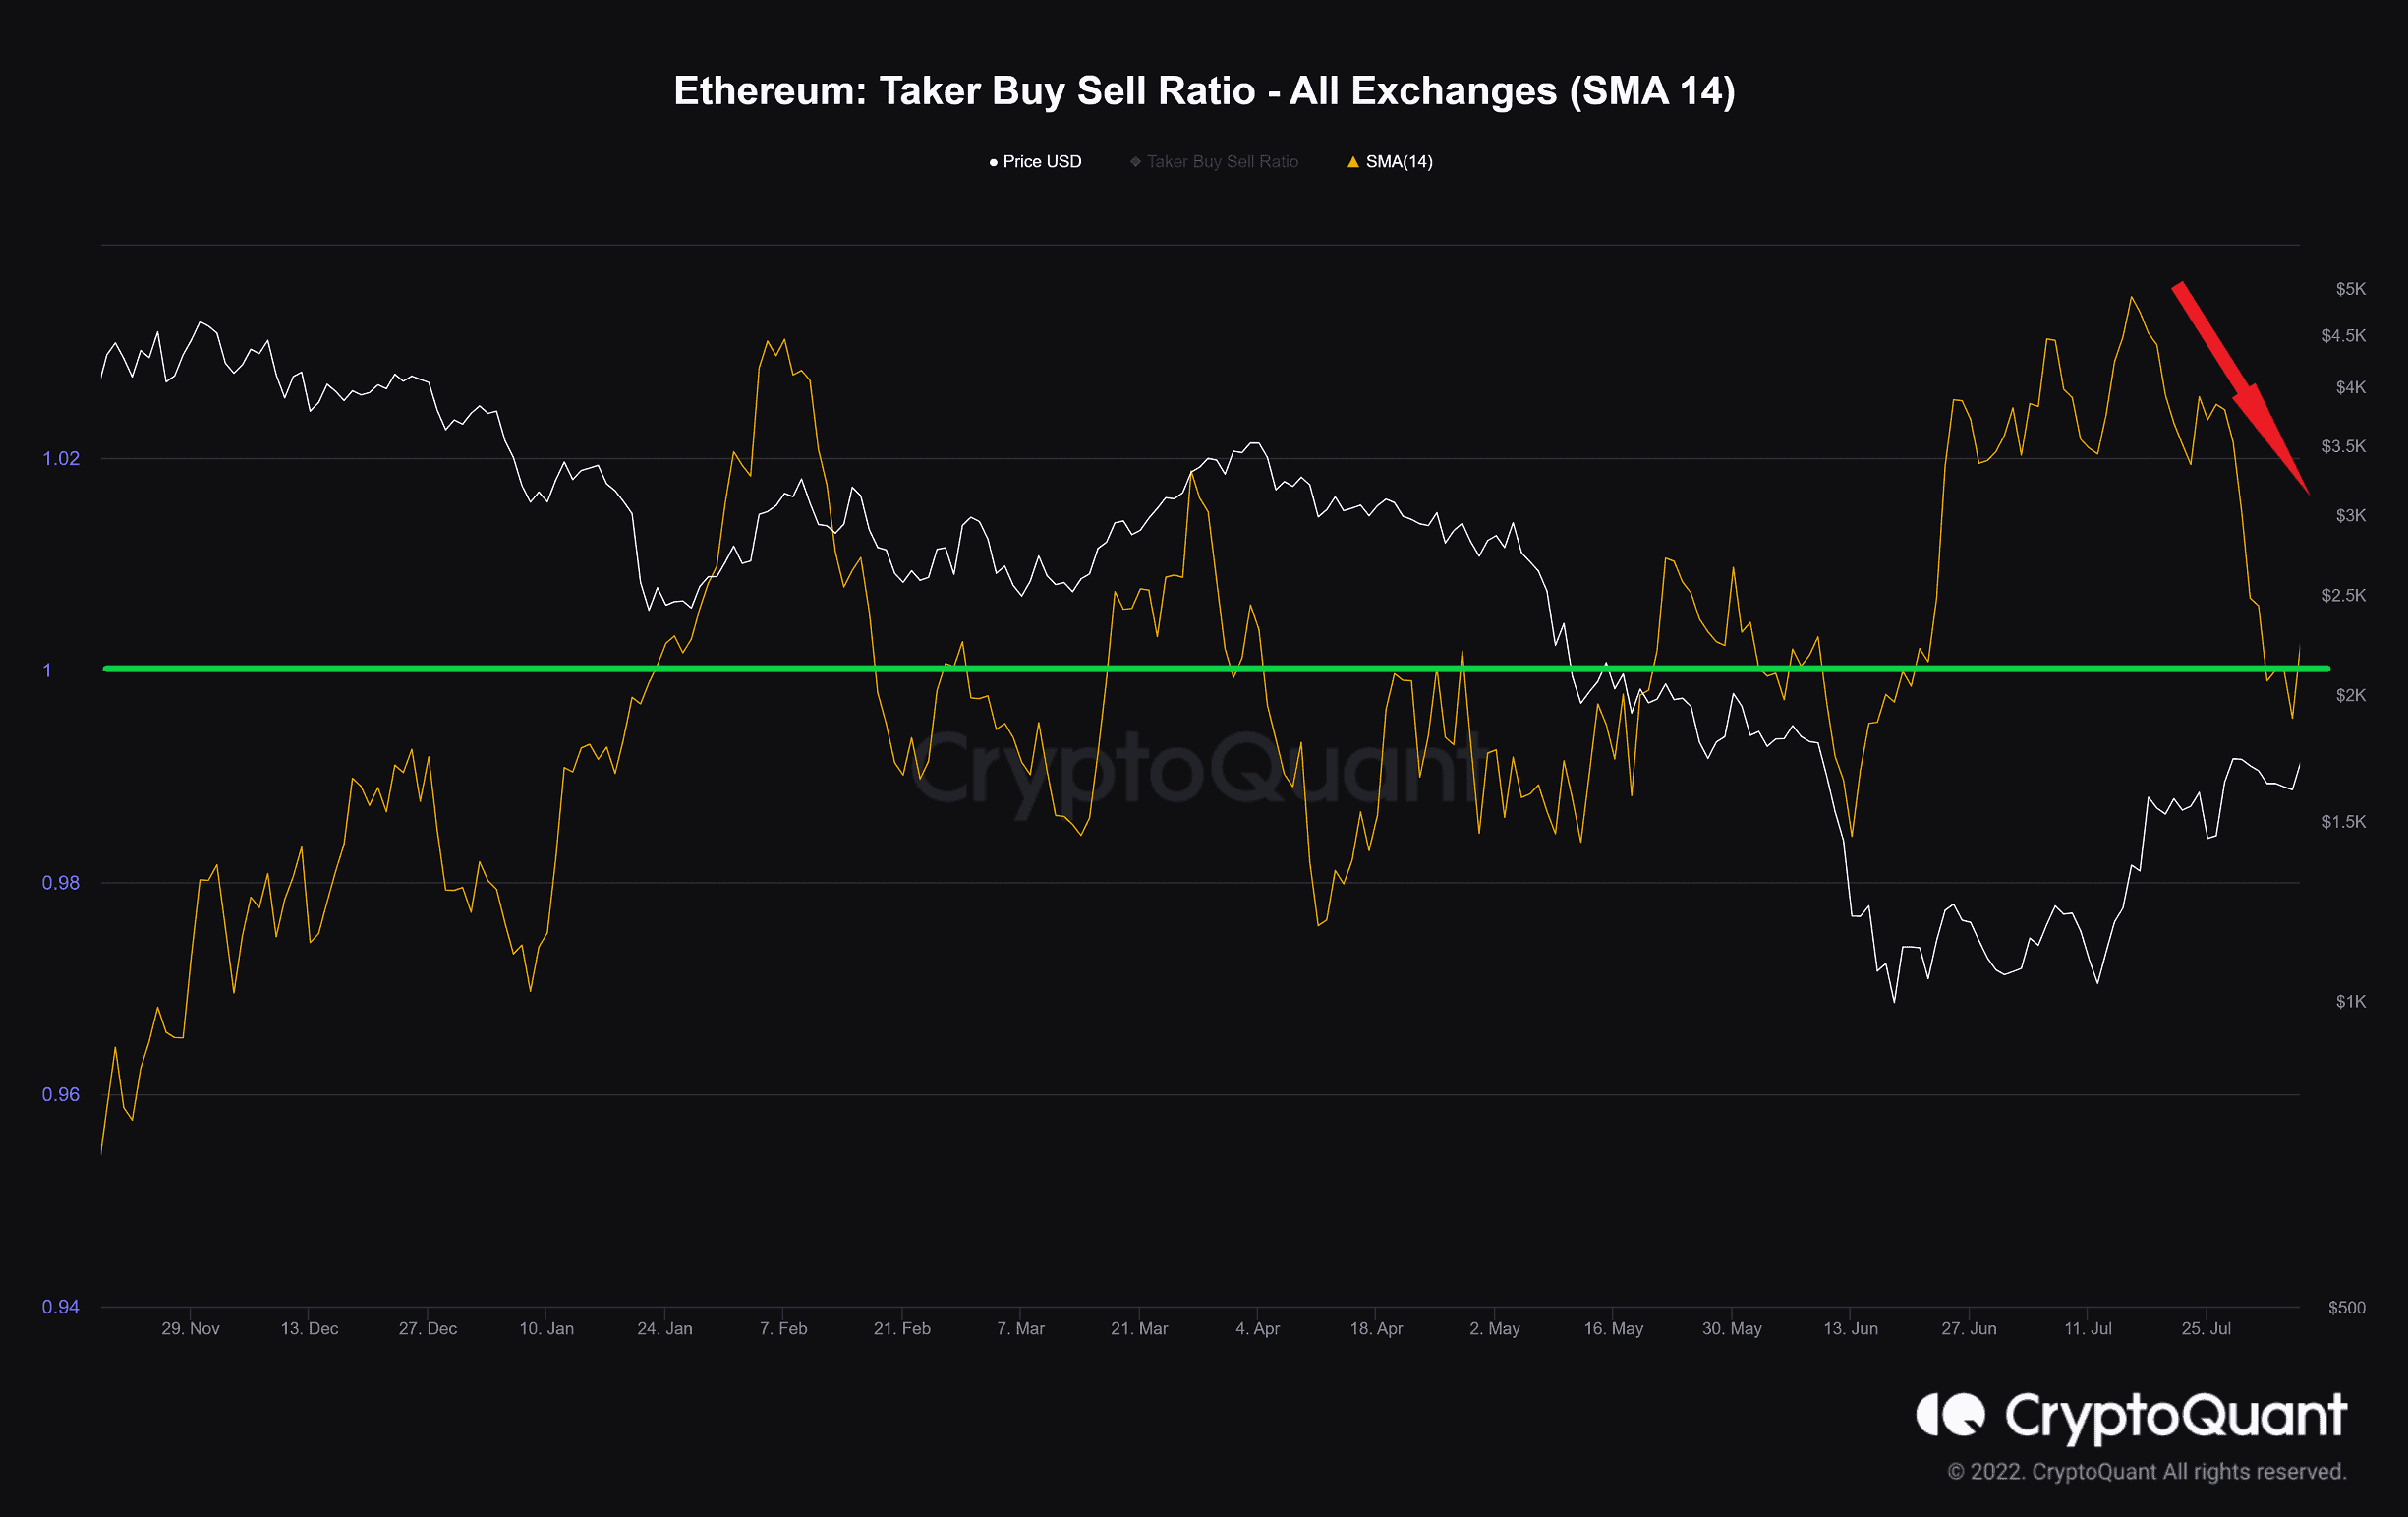
Alıcı Alış Satış Oranı
Tanım: Sürekli takas işlemlerinde alım hacminin alıcıların satış hacmine oranı.
1'in üzerindeki değerler, yükseliş hissinin baskın olduğunu gösterir.
1'in altındaki değerler, düşüş eğiliminin baskın olduğunu gösterir.
Evidently, takers have filled additional buy orders in the last three months. This caused Ethereum to experience a significant price climb. But since July 18, this metric has been moving downwards. Although it is still above the baseline (in green), it suggests that the strength of the takers on the buy side is gradually decreasing. This issue is likely due to profit-taking around the solid resistance by short-term traders.
Binance Ücretsiz 100$ (Özel): Bu bağlantıyı kullan kayıt olmak ve ilk ay Binance Vadeli İşlemlerinde 100$ ücretsiz ve %10 indirimli ücret almak için (şartlar).
PrimeXBT Özel Teklifi: Bu bağlantıyı kullan Kaydolmak ve depozitolarınızdan 50$'a kadar almak için POTATO7,000 kodunu girmek için.
Feragatname: CryptoPotato'da bulunan bilgiler alıntılanan yazarlara aittir. CryptoPotato'nun herhangi bir yatırım alıp satmayacağı veya satmayacağı hakkındaki görüşlerini temsil etmez. Herhangi bir yatırım kararı vermeden önce kendi araştırmanızı yapmanız tavsiye edilir. Verilen bilgileri kullanmak kendi sorumluluğunuzdadır. Daha fazla bilgi için Sorumluluk Reddi Beyanı'na bakın.
Kripto para grafikleri TradingView tarafından.
Source: https://cryptopotato.com/eth-with-another-attempt-to-reclaim-1-7k-will-it-succeed-ethereum-price-analysis/