By the end of Sunday, the market is trading in the neutral zone as the rates of some coins are yükselen, while others are falling.
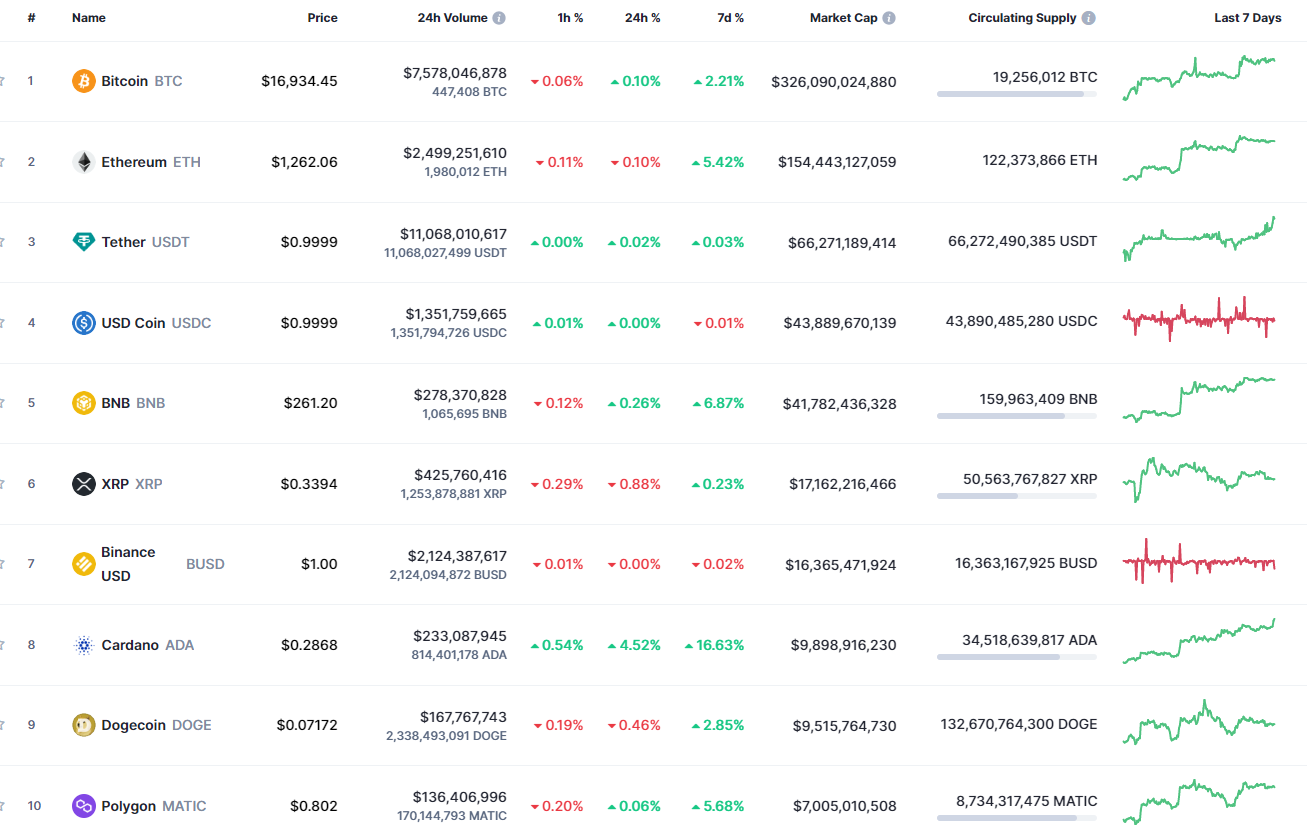
ETH / USD
The rate of Ethereum (ETH) has declined by 0.10% since yesterday. Over the last week, however, the price has risen by 5.42%.
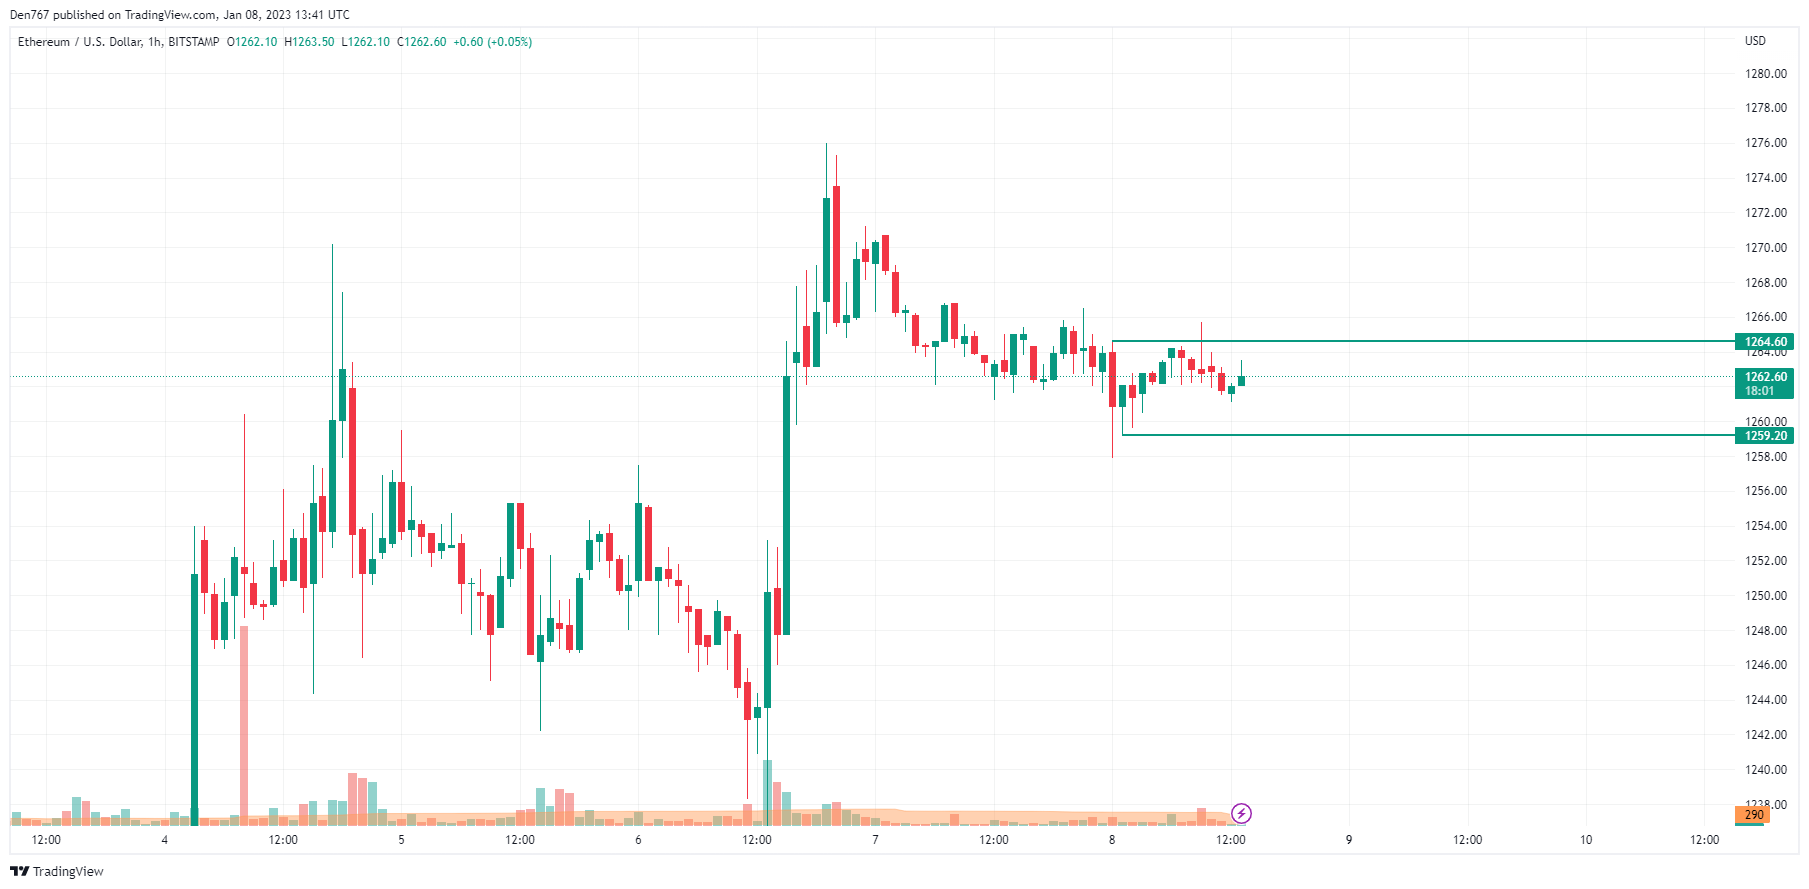
On the local chart, the price has made a false breakout of the resistance at $1,264. At the moment, the rate is located in the middle of the narrow channel. From the technical point of view, traders are unlikely to see sharp moves as Ethereum (ETH) has passed most of its Average True Range (ATR).
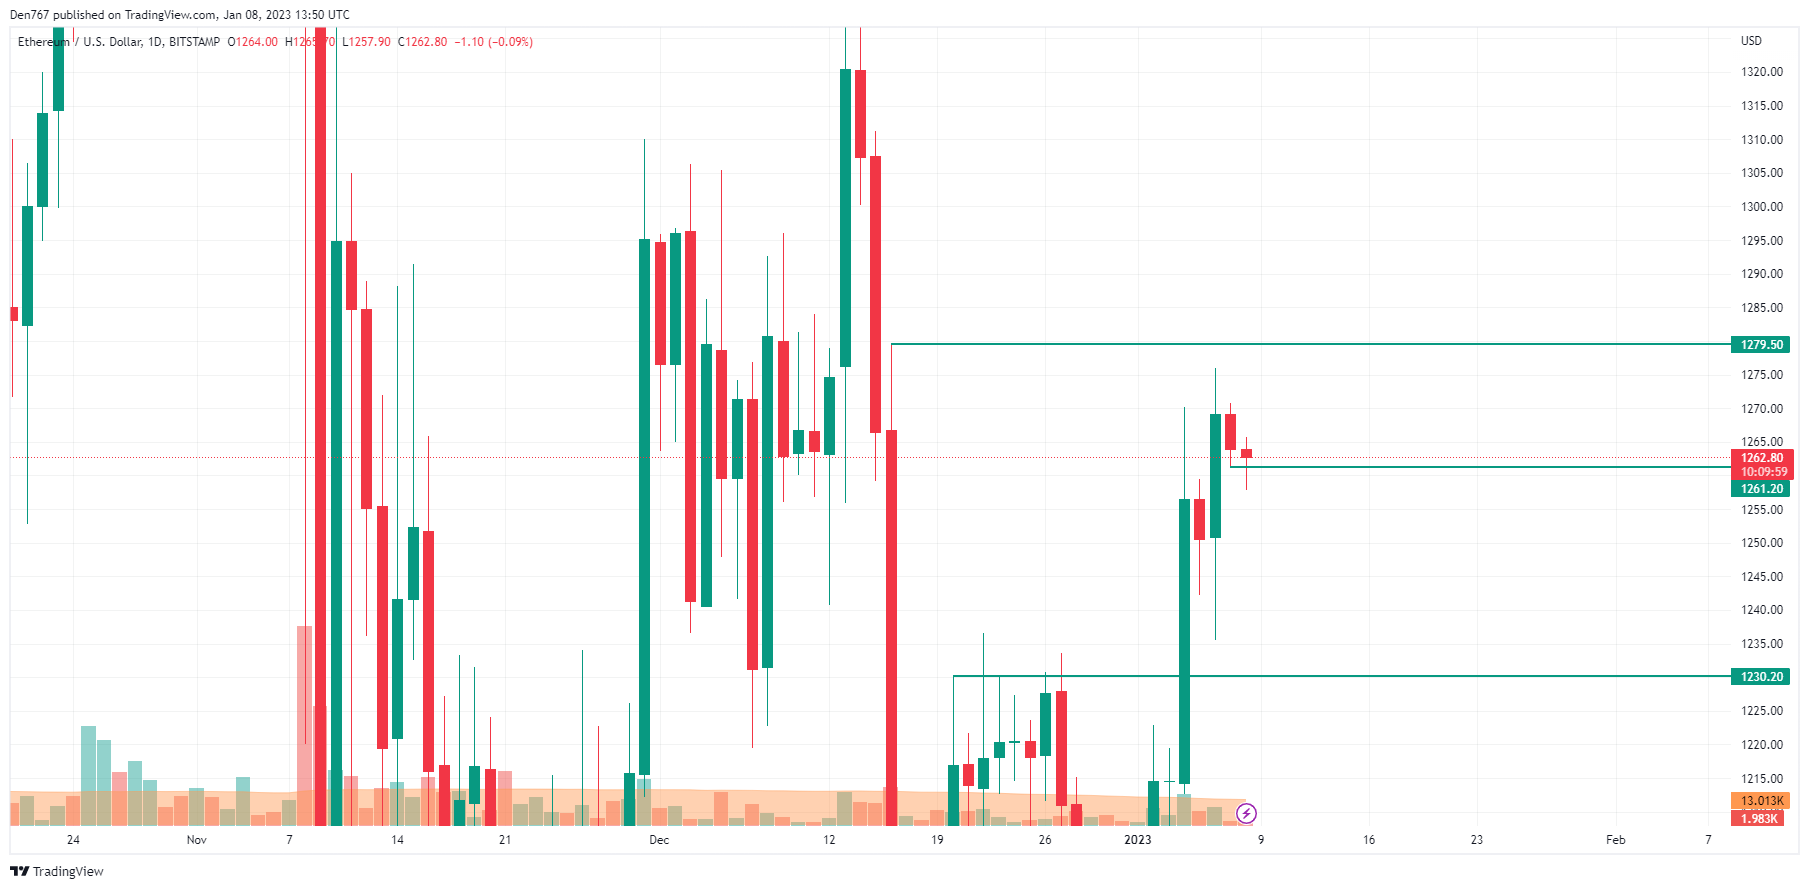
On the daily chart, the price of Ethereum (ETH) has made a false breakout of yesterday’s low at $1,261.20. If the candle closes above it, the bounce back may continue to the next resistance area around $1,270.
Thus, the selling volume is low, which means that bears are running out of strength.
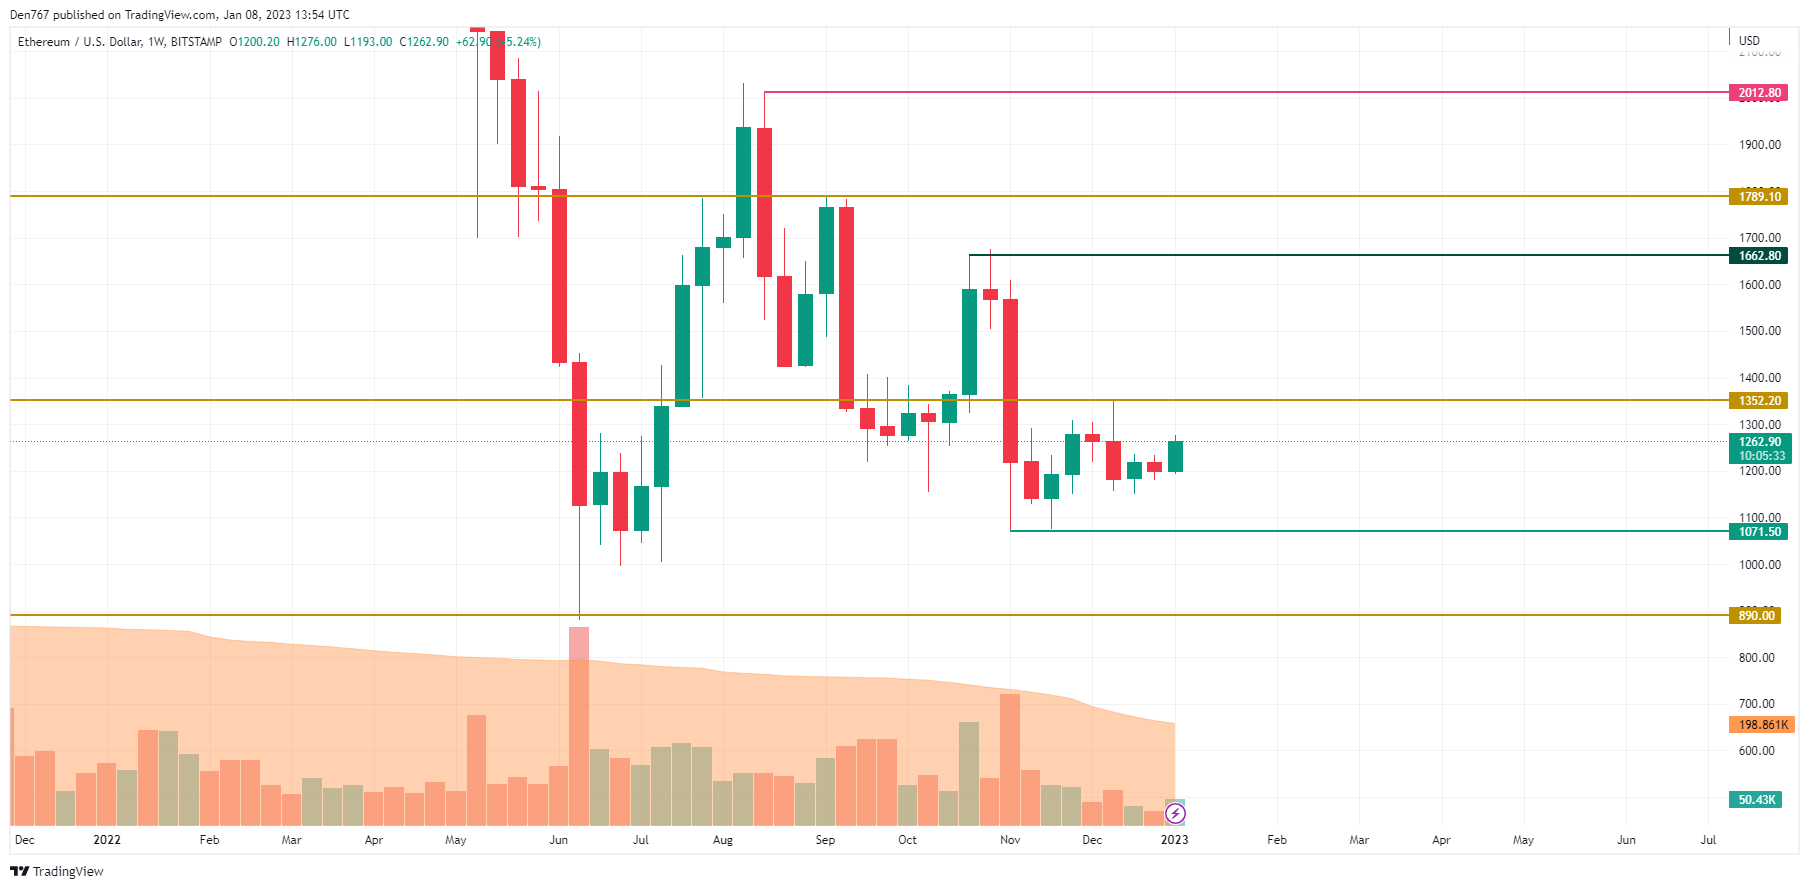
On the weekly time frame, Ethereum (ETH) keeps accumulating power for a further move as the rate is far away from the key levels. At the moment, one should pay attention to the $1,300 zone. If buyers can return to it, there is a high chance to see a breakout of the resistance at $1,352 soon.
Ethereum, baskı anında 1,262 dolardan işlem görüyor.
Kaynak: https://u.today/ethereum-eth-price-analysis-for-january-8