Ethereum price analysis shows bearish conditions in line with the overall market today. An overall decrease of 0.56 percent has been marked on Ethereum today. The price fell from a 24-hour high of $1233 to $1199 before slightly retracing again. However, there are further chances of recovery.

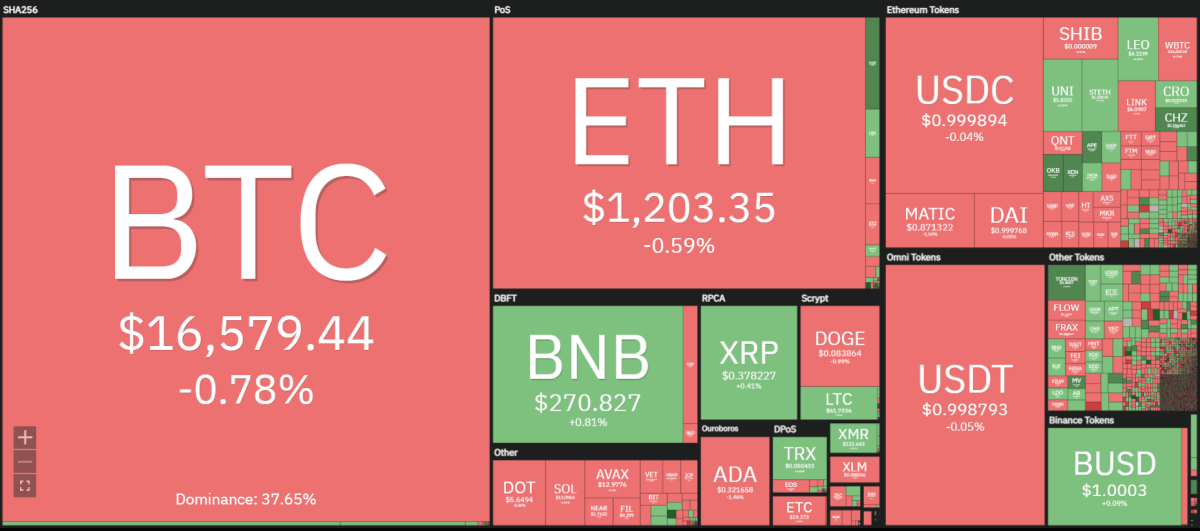
The crypto heat map shows that most coins are trading in the red, except a few. The market has been bearish for a couple of days now.

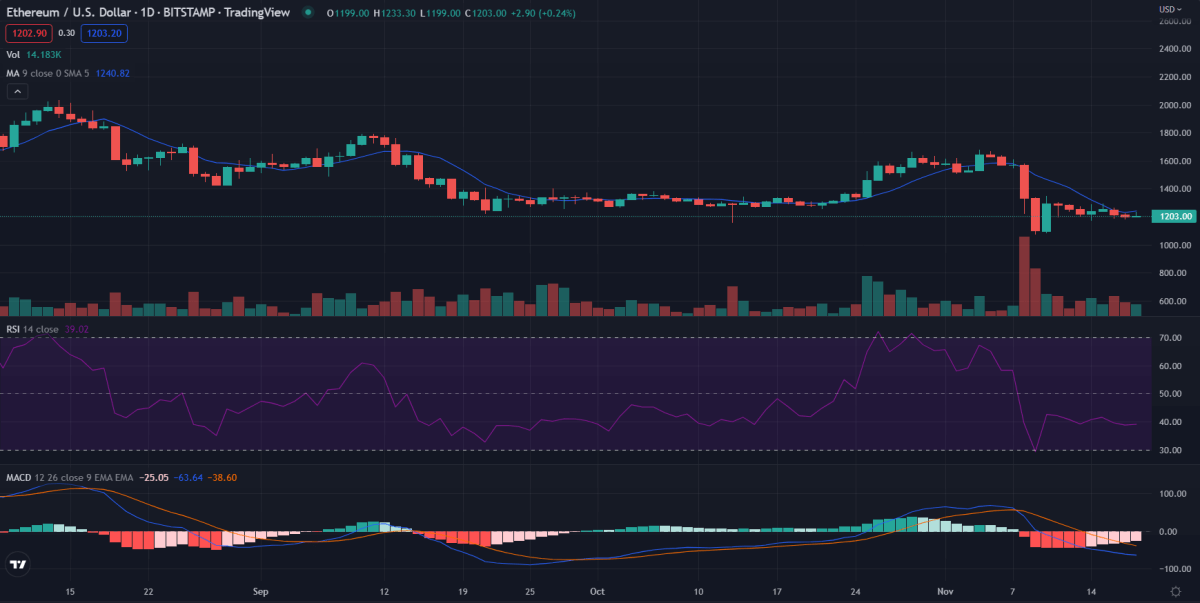
If we look at the daily Ethereum fiyatı analysis chart, we can see that Ethereum has found strong support at $1071. The conditions don’t really look very positive for Ethereum. Over the past week, ETH/USD has been dipping with slight recoveries in between. But the overall trend is downwards.
It may start consolidating between $1300 and $1200 again. However, considering the recent trend in the market, it would not be surprising if Ethereum found stability in the $1000 – $1100 region. For now, it looks like ETH/USD is slowly headed to retest $1071.
Ethereum 24 saatlik fiyat hareketi
In the last 24 hours, Ethereum’s market cap has reduced by 0.51 percent. The trading volume also got lowered by 18 percent. This leaves its volume-to-market cap ratio at 0.0557. But like always, Ethereum maintains its #2 market rank.
It marked a 24-hour high of $1233 with a 24-hour low of $1199, indicating that there is a decent amount of volatility present. However, it is certainly not comparable with Ethereum’s most volatile days. For the most part, we can say that the market is consolidating sideways on shorter timeframes.
4-hour Ethereum price analysis: ETH/USD continues to consolidate sideways

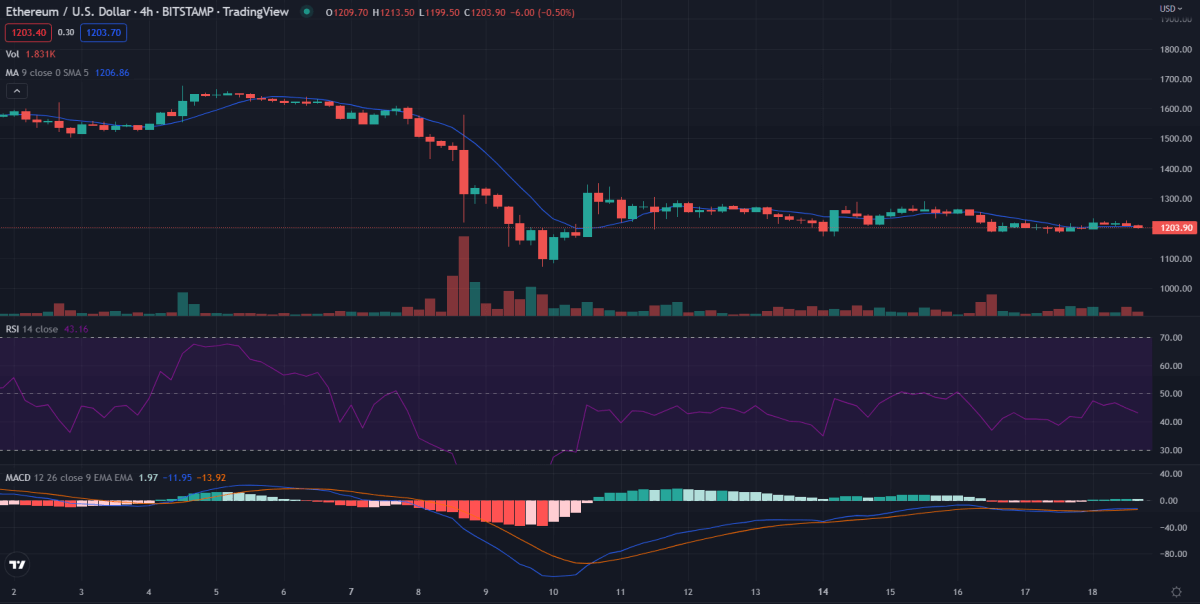
For now, Ethereum is consolidating sideways. It retraced after touching the daily low of $1199. The next local support is set at $1172, which seems to be the next target for Ethereum. The 4-hour chart shows that the bulls are slowly losing control. So, after this brief period of consolidation, Ethereum can certainly test the $1172 support. However, it is still far away from $1071.
Furthermore, we can see an impending crossover on the MACD lines. This suggests that a shift in momentum is likely to happen soon. So, there is a high chance for Ethereum to continue dipping further. Whether it will break below the support or not is a different story. But considering the market conditions, it would not be surprising to see it breaking low.
Ethereum fiyat analizi: Sonuç
Currently, Ethereum price analysis continues to consolidate sideways. However, the 4-hour MACD indicator tells us that the bears are going to overtake. This may not be a good time to buy Ethereum for a short-term profit. However, if we look at the bigger picture, Ethereum is still significantly down from its all-time high. If you believe that the kripto geleceği is bright, then try to DCA (dollar cost average) your position in Ethereum and hold for the long term.
Yasal Uyarı. Sağlanan bilgiler ticaret tavsiyesi değildir. Cryptopolitan.com, bu sayfada verilen bilgilere dayanarak yapılan yatırımlardan sorumlu değildir. Herhangi bir yatırım kararı vermeden önce, bağımsız araştırma ve / veya kalifiye bir profesyonele danışmayı şiddetle tavsiye ederiz.
Kaynak: https://www.cryptopolitan.com/ethereum-price-analysis-2022-11-18/
