Ethereum’s uptrend has been halted after reaching the major resistance at $1.7K. The price action seems choppy, while a short-term correction is what many expect.
Teknik Analiz
By Shayan
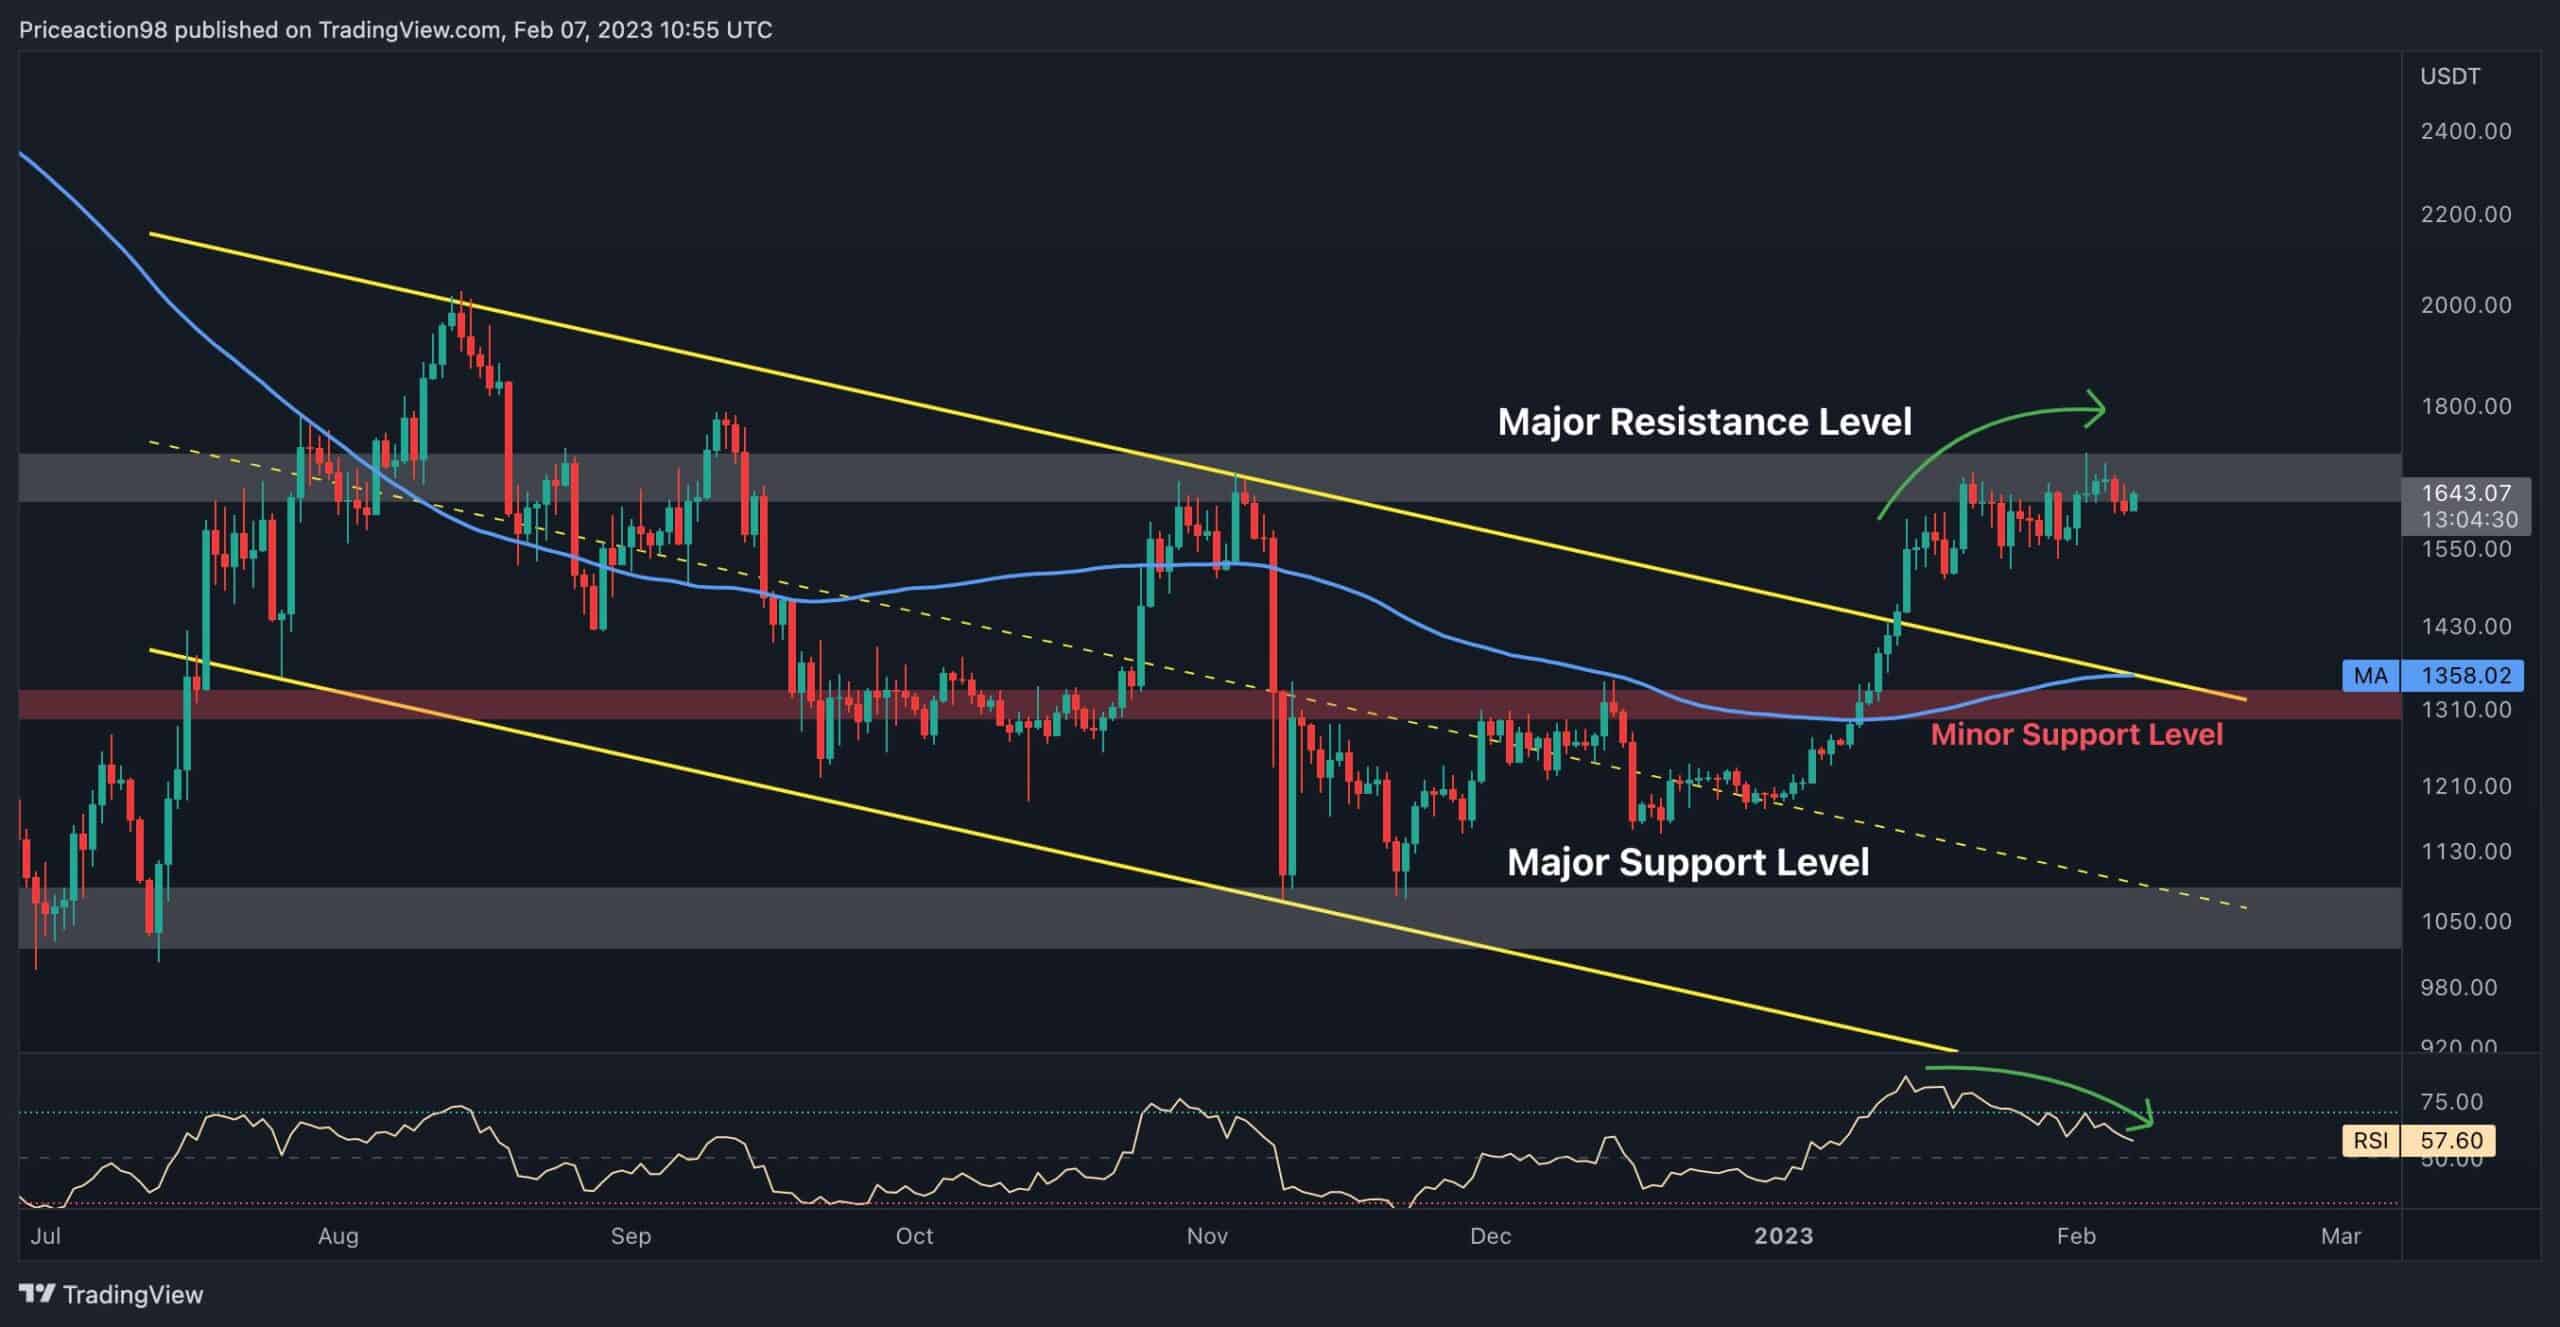
Günlük Grafik
Ethereum has surpassed the 200-day moving average and the multi-month channel’s upper trendline due to the recent bullish move of the whole market. However, the price declined from the major resistance level of $1.7K and is now consolidating beneath it.
On the other hand, there is a substantial bearish divergence between the price and the RSI indicator on the daily timeframe. It could lead to volatility in the upcoming days.

Nonetheless, there are three critical static levels for Ethereum on the daily chart; the $1.7K major resistance level, the $1.3K minor support level, and the $1K major support level.
The price has been ranging between $1K and $1.7K for several months, and the $1.3K minor support level is likely to be Ethereum’s next stop in case of rejection from $1.7K.
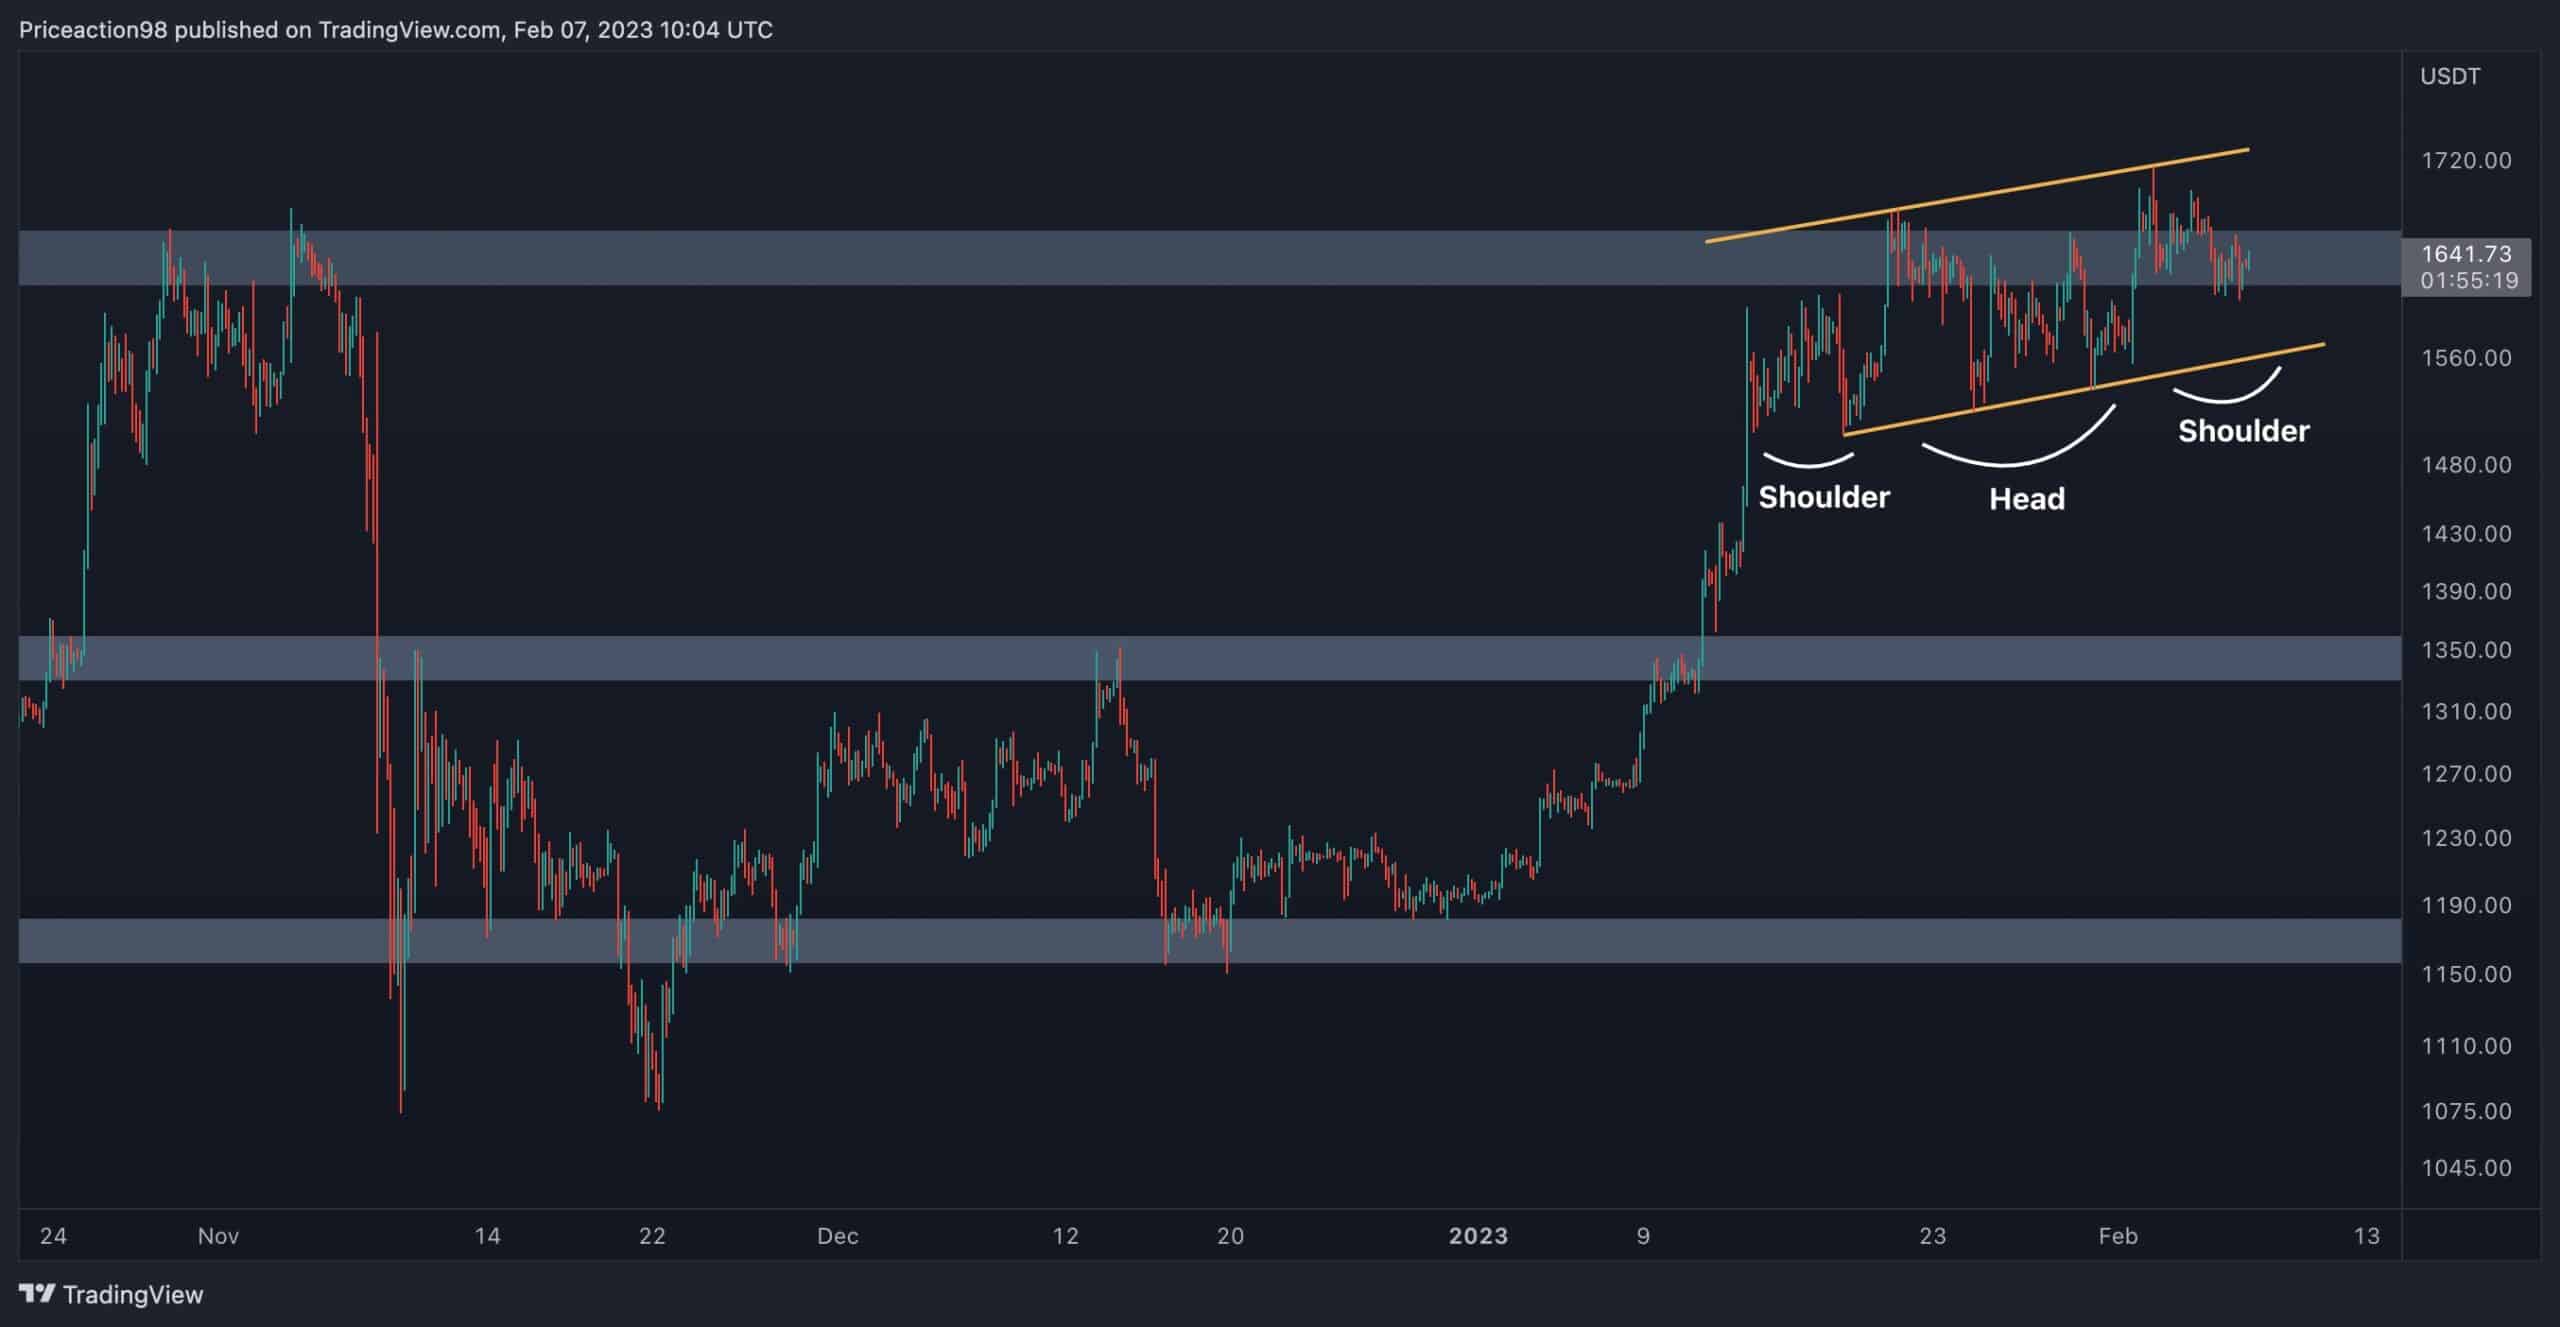
4 Saatlik Grafik
Ethereum’s price action seems to be bearish on the 4-hour timeframe as it has been forming an ascending Head and Shoulder pattern, also known as a three drives pattern, a popular reversal pattern in the classic price action, after reaching a vital resistance region.
If the cryptocurrency cascades below the neckline, roughly at $1.5K, the market should expect a short-term plummet toward the $1.3K minor support level. Hence, considering the current price action and the bearish signs mentioned above, Ethereum is likely to experience a period of consolidation correction before the next impulsive move.
Zincir Üzerinde Analiz
By Shayan
The following chart demonstrates the Open Interest metric’s 14-day RSI alongside Ethereum’s price. Following the recent uptrend in Bitcoin’s price during the last two weeks, ETH has also printed a surge, showing signs of demand in the market.
As a result, the futures market activity has also increased in the last week resulting in an uptrend in Ethereum’s Open Interest. Typically, when the Open Interest’s RSI reaches the red zone (above 70), the possibility of a short-term correction expands.
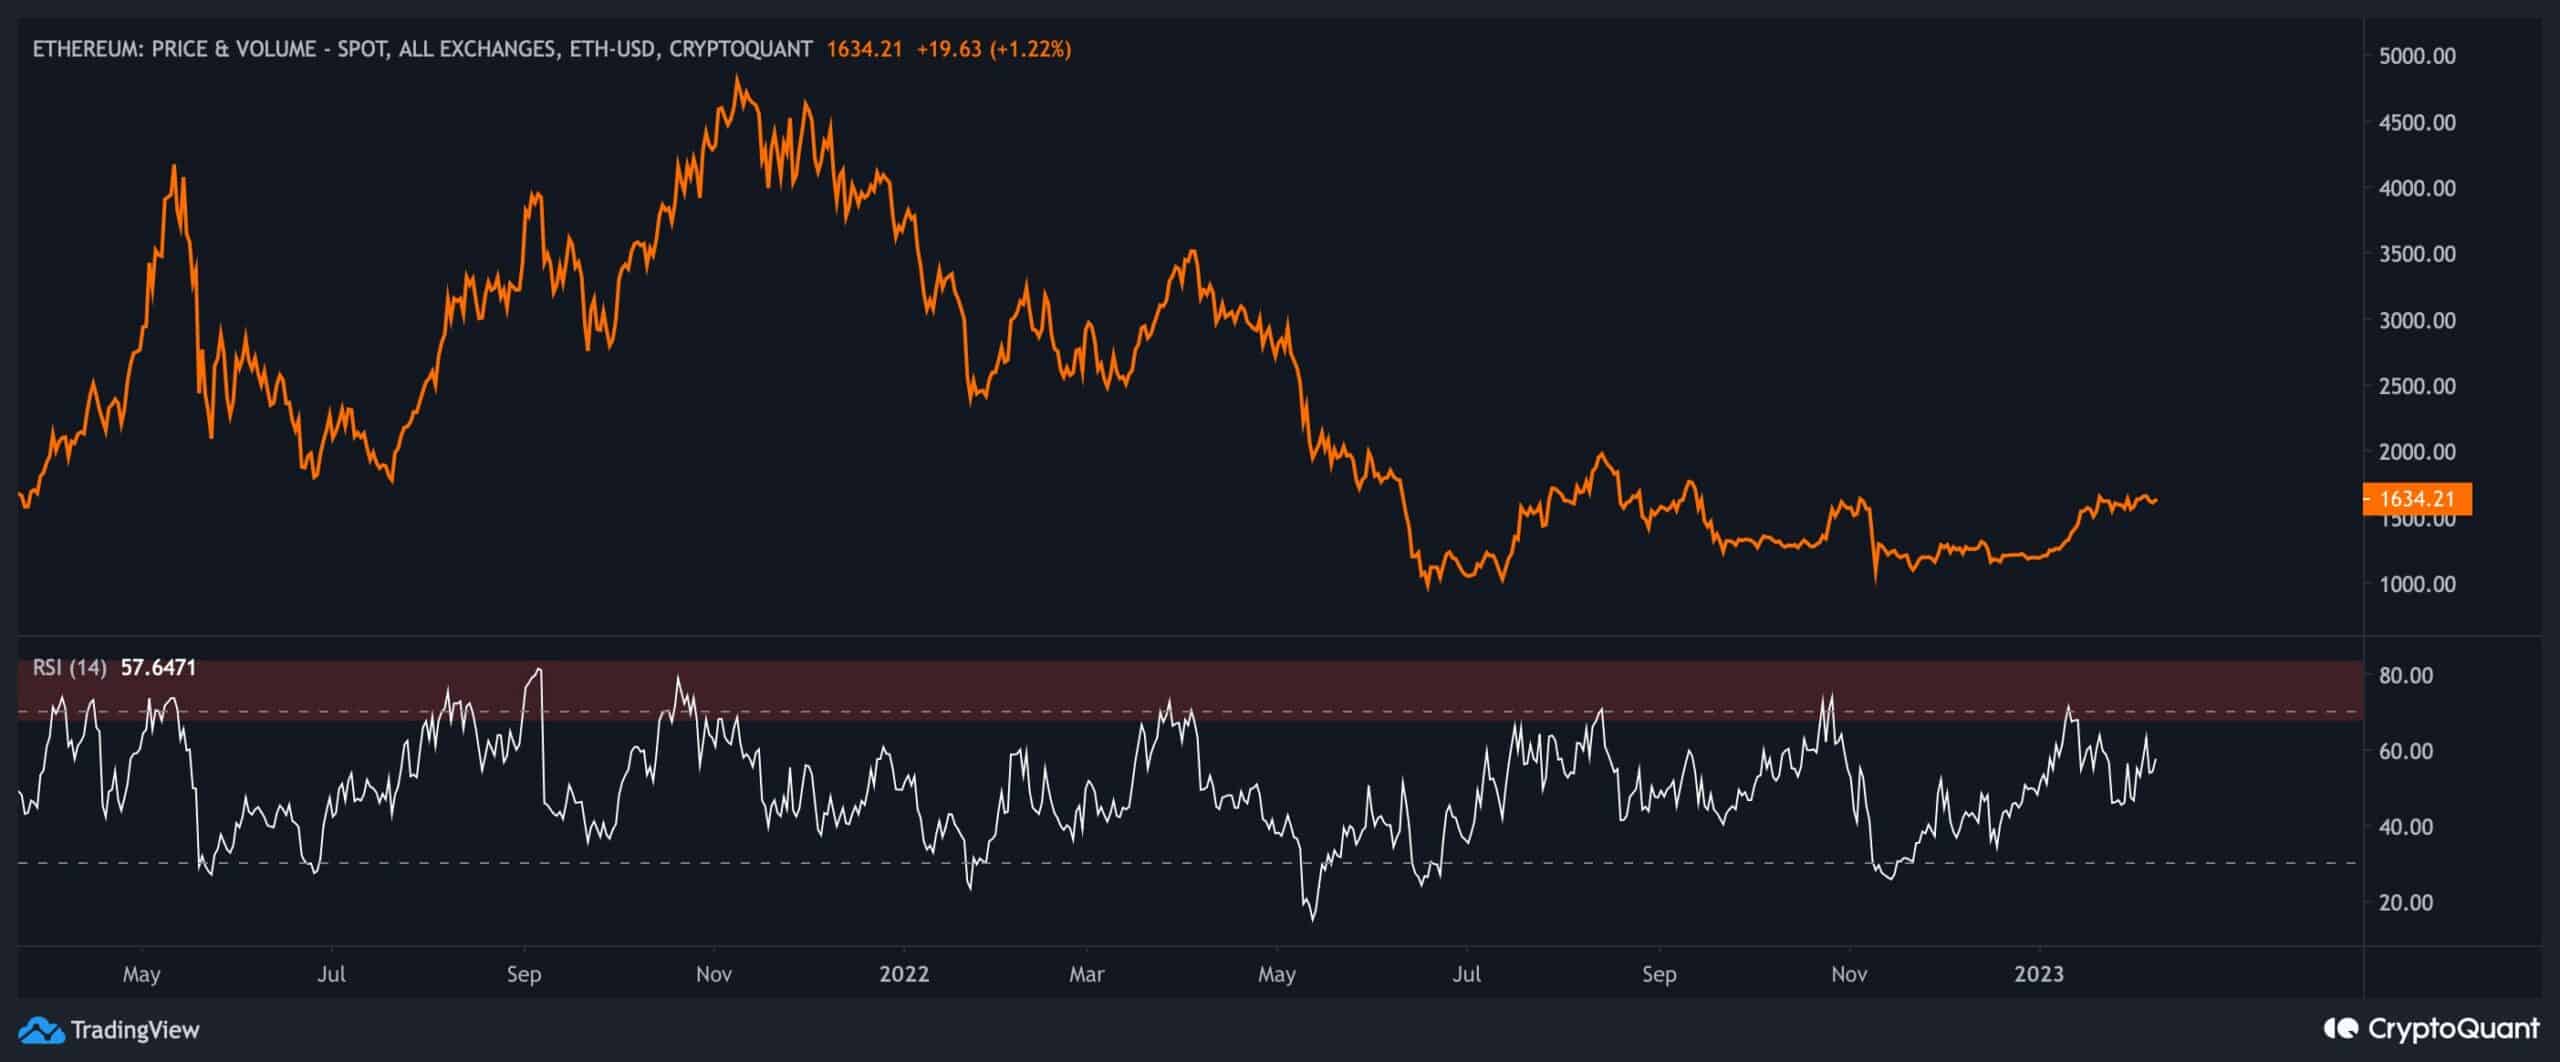
Presently, the metric has surged and is close to entering the red area. Accordingly, a short-term plummet might flush out the highly leveraged long positions. This structure underlines the risk of the futures market in the short term.
Binance Ücretsiz 100$ (Özel): Bu bağlantıyı kullan kayıt olmak ve ilk ay Binance Vadeli İşlemlerinde 100$ ücretsiz ve %10 indirimli ücret almak için (şartlar).
PrimeXBT Özel Teklifi: Bu bağlantıyı kullan Kaydolmak ve depozitolarınızdan 50$'a kadar almak için POTATO7,000 kodunu girmek için.
Feragatname: CryptoPotato'da bulunan bilgiler alıntılanan yazarlara aittir. CryptoPotato'nun herhangi bir yatırım alıp satmayacağı veya satmayacağı hakkındaki görüşlerini temsil etmez. Herhangi bir yatırım kararı vermeden önce kendi araştırmanızı yapmanız tavsiye edilir. Verilen bilgileri kullanmak kendi sorumluluğunuzdadır. Daha fazla bilgi için Sorumluluk Reddi Beyanı'na bakın.
Kripto para grafikleri TradingView tarafından.
Source: https://cryptopotato.com/heres-the-first-support-for-eth-in-case-of-a-short-term-correction-ethereum-price-analysis/