
- FLOW has seen bullish actions in previous sessions
- The pair of FLOW/USD is trading at the price level of $0.718 with a gain of 8.27% in the past 24 hours.
AKIŞI cryptocurrency is seeing one of the worst price runs in the cryptocurrency market. Despite reaching new development milestones, the currency is presently trading near all-time lows. FLOW is the native currency of Dapper Labs’ FLOW layer one blockchain, which was launched in December 2019. Dapper Labs is the business behind CryptoKitties and the NBA Top Shot NFT initiative. Since the NBA’s Top shot NFT bull run began to fade in April 2021, the price of FLOW crypto has dropped by more than 98%. NFTs on the blockchain are seeing a reduction in adoption as well as a dramatic monthly drop in trading volumes.
Are Technical Indicators in favor of bulls?
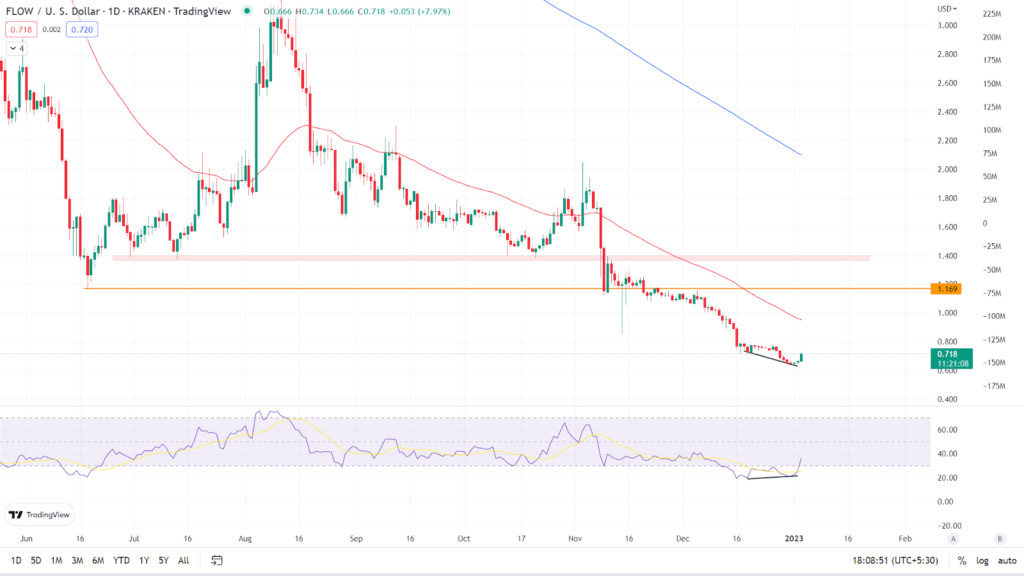
FLOW is presently trading at $0.718 with an 8.27% gain in the last 24 hours, as seen on the daily chart. Following a sharp decline in the token’s price over the last few days, we have witnessed some rebound and relief for investors. The token is trading below its main Moving Averages (50 and 200 EMA). (The blue line represents the 200 EMA, while the red line represents the 50 EMA.) On the daily chart, we can see bullish divergence forming.
Göreceli Güç Endeksi The asset’s RSI curve is presently trading at 36.96 and is approaching the halfway mark of 50 from the strong oversold zone. The RSI curve has crossed over the 14 SMA, suggesting that the token is bullish. On the chart, bullish divergence is formed when prices fall to a new low but an indicator fails to hit a new low.
Analist görüşü ve Beklentiler
Bulls are taking action following a sharp decrease in the value of the token. To keep the bullish trend going, the token should cross the 50 EMA and stay above it. It is recommended that investors wait for trend confirmation. Intraday traders have a good opportunity to buy and achieve their target till the 50 EMA depending on their risk-reward ratio.
According to our current Flow price forecast, the value of Flow is expected to fall by -6.44% and reach $ 0.671551 in the next few days. Our technical indicators indicate that the current sentiment is bearish, with the Fear & Greed Index reading 26. (Fear). Over the previous 30 days, Flow has 9/30 (30%) green days and 17.82% price volatility.
Teknik Seviyeler
Ana destek: 0.642 $
Büyük direnç: 0.783 dolar
Sonuç
Bulls are trying to gain traction, but we cannot say that the trend has reversed; this might be a retracement following a significant drop in the token’s price. Investors should wait for a clear trend direction before acting.
Yasal Uyarı: Yazar veya bu makalede adı geçen kişiler tarafından belirtilen görüş ve görüşler yalnızca bilgilendirme amaçlıdır ve finansal, yatırım veya diğer tavsiyeleri oluşturmaz. Kripto varlıklarına yatırım yapmak veya alım satım yapmak, finansal kayıp riskiyle birlikte gelir.
Source: https://www.thecoinrepublic.com/2023/01/03/flow-technical-analysis-following-rsi-bullish-divergence-flow-gains-8-27/