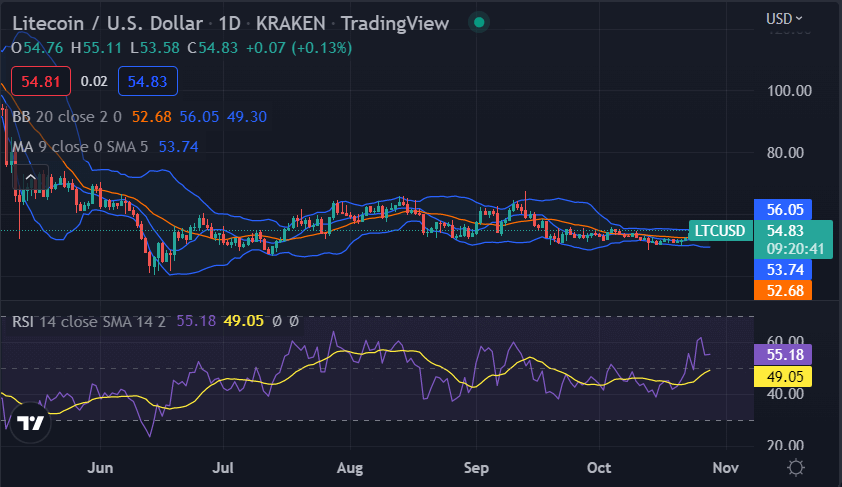
Litecoin fiyatı analysis confirms a decreasing trend for cryptocurrency today as the coin value has degraded. The bearish trend is being eyed by the market as LTC/USD falls from $56.30 to a current value of $54.83. Resistance for the pair is found at $55.95, with support at $53.74. Bullish efforts observed during the last two days were not enough to sustain prices, but still present the possibility for short-term gains if the price can break above resistance.
Litecoin price analysis 1-day price chart: Bearish strike deflated the price to $54.83 level
The one-day Litecoin price analysis confirms a strong bearish trend for today as the coin value has undergone a considerable decline during the last 24 hours. The selling pressure remained persistent throughout the last week. And today, the market is again in support of the bears as the price has decreased by 1.63% in the last 24 hours. The market capitalization for Litecoin is currently at $3.91 billion with a 24-hour volume of $507 million. The moving average (MA) has been steadily decreasing, indicating a bearish trend. The bulls will have to break above the $55.95 resistance level in order for any potential gains.

In the daily chart, Litecoin price analysis shows that the Relative Strength Index (RSI) is approaching oversold levels at 49.05, indicating possible bullish momentum in the near future. The Bollinger bands have also tightened, indicating a decrease in market volatility. The upper Bollinger band now rests at $55.95, representing the highest resistance, and the lower Bollinger band is found at $53.74, which represents the support for LTC.
Litecoin fiyat analizi: Son gelişmeler ve diğer teknik göstergeler
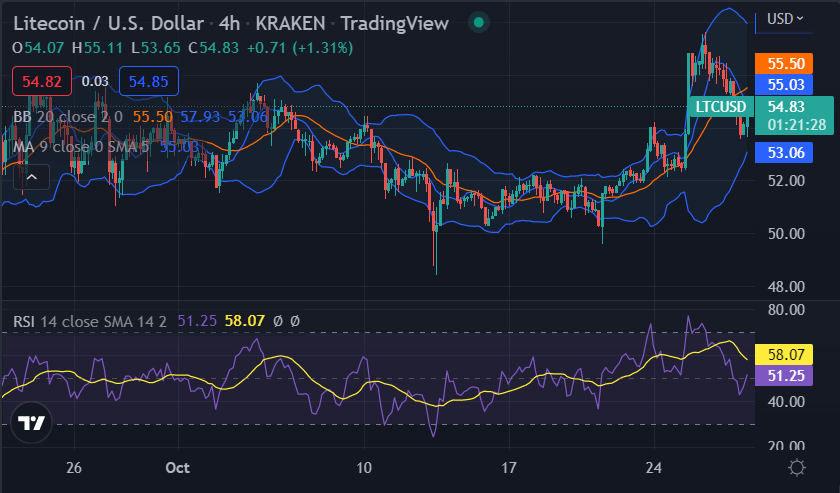
The hourly Litecoin price analysis shows a dramatic drop in price levels which intensified during the last four hours. The price breakdown was also downwards today, but bulls also tried to make a comeback late at night but were rejected after minimal efforts. A sharp decrease in price levels has been observed just recently as bears crashed the price down to $54.83. This sharp decline has come after prolonged efforts to maintain the price levels of the coin.

The volatility is slowly decreasing on the 4-hour chart as the upper curve of the Bollinger bands is now converging downwards at the $55.50 mark. At the same time, the lower band is maintaining its position at the $53.06 mark below the price level. The RSI is also at a steep downward curve at an index of 58.07 and is moving toward the border of the underbought area. The Moving average(MA) has also declined to the current level of $55.03, indicating a bearish trend in the market.
Litecoin fiyat analizi sonucu
To sum up, the Litecoin price analysis shows a bearish trend for LTC/USD as the coin value has decreased to $54.83. The bearish trend is expected to continue in the near term, but bulls may have a chance for short-term gains if they can break above the $55.95 resistance level.
Yasal Uyarı. Sağlanan bilgiler ticaret tavsiyesi değildir. Cryptopolitan.com, bu sayfada verilen bilgilere dayanarak yapılan yatırımlardan sorumlu değildir. Herhangi bir yatırım kararı vermeden önce, bağımsız araştırma ve / veya kalifiye bir profesyonele danışmayı şiddetle tavsiye ederiz.
Kaynak: https://www.cryptopolitan.com/litecoin-price-analysis-2022-10-28/
