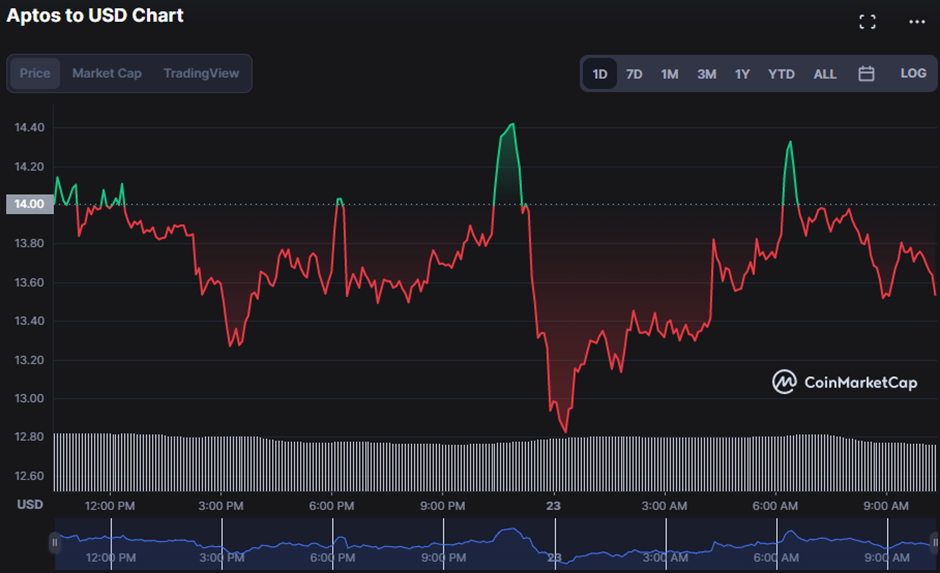
- In the last 24 hours, bear grip in APT market pushed price to a low of $12.77
- Technical indicators alert traders of a near-term favorable comeback.
- Bulls in APT must break through $14.48 to reach new heights.
Aptos (APT) hits a new 24-hour low of $12.77 as selling pressure from the previous day continues to weigh on the market. During the decline, a recovery encountered stiff resistance at $14.48.
At the time of writing, the bears had successfully pushed the APT price down to $13.50, a drop of 3.61%.
Sonucu olarak Aptos fiyatı drop, market capitalization and 24-hour trading volume fell by 3.53% to $2,168,270,334 and 20.47% to $1,753,282,654, respectively. This dip indicates that investor confidence in the APT market is low, leading to a decrease in willingness to invest and trade.
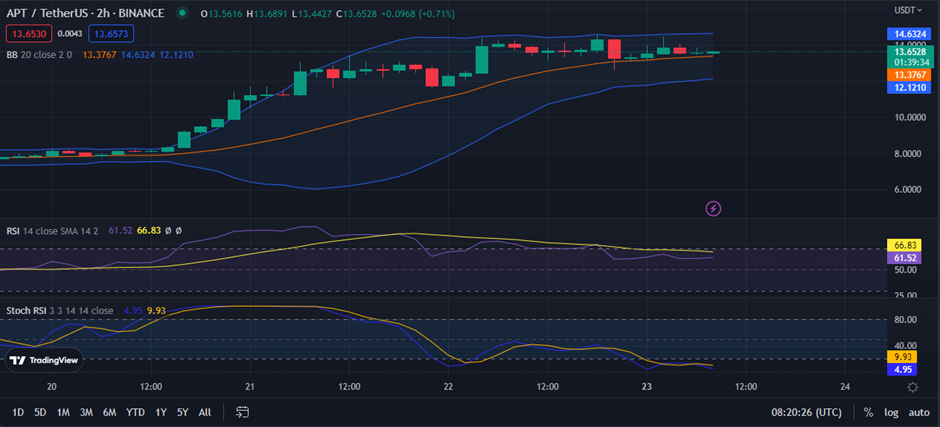
The linear movement of the Bollinger bands on the 2-hour price chart, with the upper band at $14.6140 and the lower band at $12.0345, is indicative of a consolidation in the market. If the bulls don’t step in to break the range, the price will oscillate between the upper and lower bands for the foreseeable future.
The Relative Strength Index (RSI) falls below its signal line with a score of 61.43, indicating that the bearish grip on the APT market is tightening as selling pressure exceeds buying pressure. Although this movement indicates a bearish market, it may also indicate an impending trend reversal if purchasing pressure rises and the RSI returns above its signal line, indicating a buy signal.
The stochastic RSI reading of 5.21 indicates that the APT market is oversold, raising the possibility of a positive trend reversal if purchasing pressure increases and the RSI crosses above its signal line. This adds to the mounting evidence that the APT market is on the verge of a trend reversal and that the bears are losing ground.
APT’s bearish trend may subside now that the 10-day MA has crossed above the 50-day MA with values of 13.6089 and 11.0160 “respectively”, indicating a possible upward trend reversal. This movement indicates that bulls are battling for market control, giving traders hope for a positive rebound.
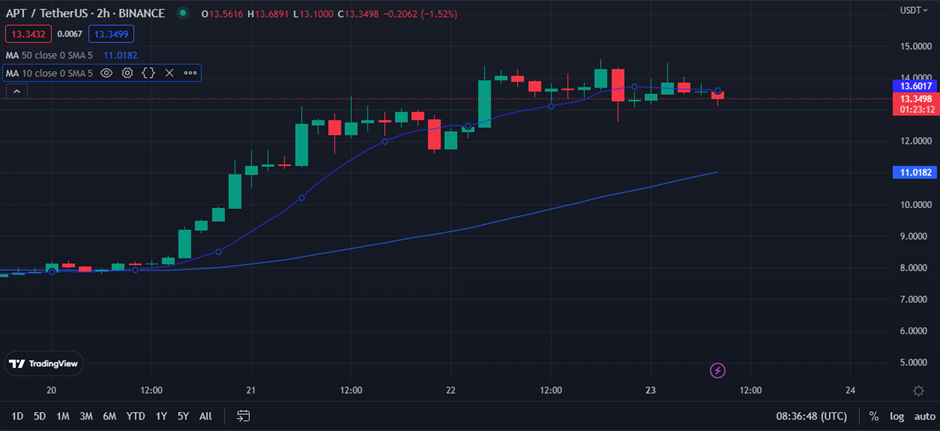
Bulls need to keep fighting in the APT market to reverse the adverse trend and raise prices higher.
Yasal Uyarı: Bu fiyat analizinde paylaşılan tüm bilgiler ile birlikte görüş ve görüşler iyi niyetle yayınlanmaktadır. Okuyucular kendi araştırmalarını ve durum tespitlerini yapmalıdır. Okuyucu tarafından yapılan herhangi bir işlem kesinlikle kendi sorumluluğundadır. Coin Edition ve iştirakleri, herhangi bir doğrudan veya dolaylı hasar veya kayıptan sorumlu tutulamaz.
Source: https://coinedition.com/as-bear-power-fizzles-in-apt-market-indicators-forecast-price-correction/