- ATOM price falls to a 7-day low due to bearish pressure.
- According to recent research, bulls have refuted bear momentum.
- Indicators indicate the upward trend may endure.
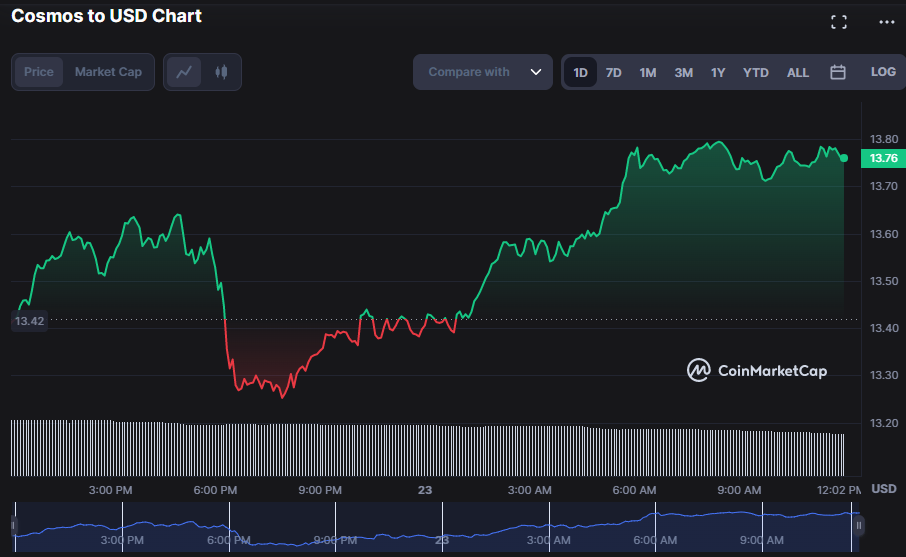
Cosmos (ATOM) bulls awoke after the price dropped to a 7-day low of $13.25, pushing it to an intraday high of $13.80. ATOM'un fiyatı has since stabilized in the $13.50 – $13.60 area, indicating growing investor confidence in the cryptocurrency’s potential value. At press time, the bullish intervention had increased the price by 2.60% to $13.76.
The market value increased by 2.56% during the upturn, reaching $3,939,430,281. This rapid influx of buying activity during this gloomy market indicates that investors are enthusiastic about ATOM’s prospects. However, despite this recent bullish intervention, it is still being determined if it was the product of genuine confidence or market manipulation, as 24-hour trading volume plummeted by 26.15% to $133,213,853.
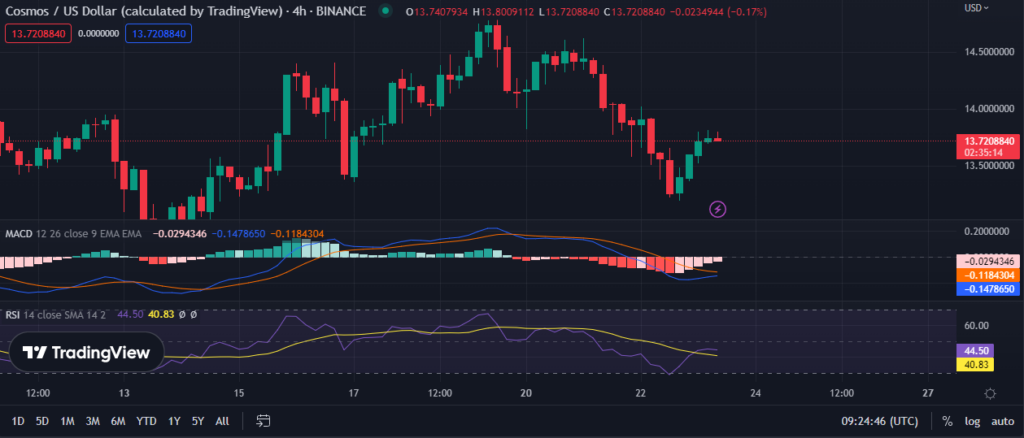
Although bullish, the blue MACD line on the 4-hour price chart swings in the negative zone with a value of -0.01433748, suggesting bearish momentum in the market. Moreover, the signal line moves in the negative zone with a value of -0.00038959, confirming the market’s bearish momentum. Finally, with a negative histogram score of -0.01374789, it’s clear that sellers control the market. This dip suggests the bearish momentum will likely carry over into the subsequent trading sessions.

The Relative Strength Index (RSI) is rising over its signal line with a score of 46.49, indicating that market sentiment favors buyers. While the MACD histogram and the signal line are declining, the higher RSI reading demonstrates that buyers are still in the market. The RSI pattern suggests that ATOM’s bullishness is growing, as it is now firmly in the buy zone with a score greater than 30, signaling the start of a bullish market trend. The RSI reading also portrays ATOM’s undervaluation, making it an intriguing option for investors looking for a good entry point into the market.
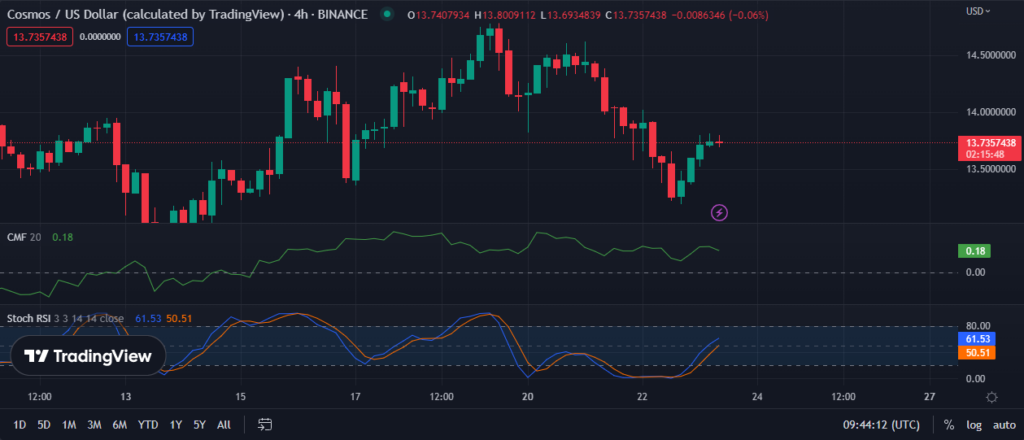
As the Chaikin Money Flow (CMF) is positive at 0.18, suggesting that more money gains by buying than is being taken out by sellers, the bullishness in ATOM may prolong. CMF movement into the positive territory indicates a more significant capital inflow into ATOM than outflow, signaling an upward price trend. ATOM will continue its bullish trend if the CMF remains favorable.
In addition, the fact that the stochastic RSI is rising and is now above its signal line at 60.98 indicates that buyers are actively participating in the market. As there is now more demand than supply, ATOM may rise in price. Overall, this strengthens the bullish thesis for ATOM, and investors should keep an eye out for buying opportunities.
If the bullishness in the ATOM market continues, bulls must keep increasing prices in the near term.
Yasal Uyarı: Bu fiyat tahmininde paylaşılan tüm bilgilerin yanı sıra görüş ve görüşler iyi niyetle yayınlanmaktadır. Okuyucular araştırmalarını ve durum tespiti yapmalıdır. Okuyucu tarafından yapılan herhangi bir işlem kesinlikle kendi sorumluluğundadır. Coin Edition ve iştirakleri, herhangi bir doğrudan veya dolaylı hasar veya kayıptan sorumlu tutulamaz.
Source: https://coinedition.com/bulls-outbreed-bears-after-atom-price-nosedives-to-7-day-low/