The price of Ripple’s XRP cleared an important resistance line and reached a new monthly high on May 30.
However, despite this breakout, the price action and wave count suggest that a local top may be in place, hence predicting a future price decrease. Additionally, the release of 500 million XRP tokens from an escrow could create additional selling pressure.
Ripple Price Clears Crucial Resistance
The price of XRP has decreased below a descending resistance line since March 28. This indicates that the price is in a short-term correction.
However, the price broke out from the line on May 26, confirming that the correction is complete. The breakout led to a high of $0.53 on May 30.
Despite the breakout, the price was rejected by the 0.618 Fib retracement resistance level at $0.52 (red icon). It has fallen since.

Fibonacci düzeltme seviyeleri teorisine göre, bir yönde önemli bir fiyat değişikliğinin ardından, fiyatın aynı yönde devam etmeden önce kısmen önceki fiyat seviyesine dönmesi beklenir.
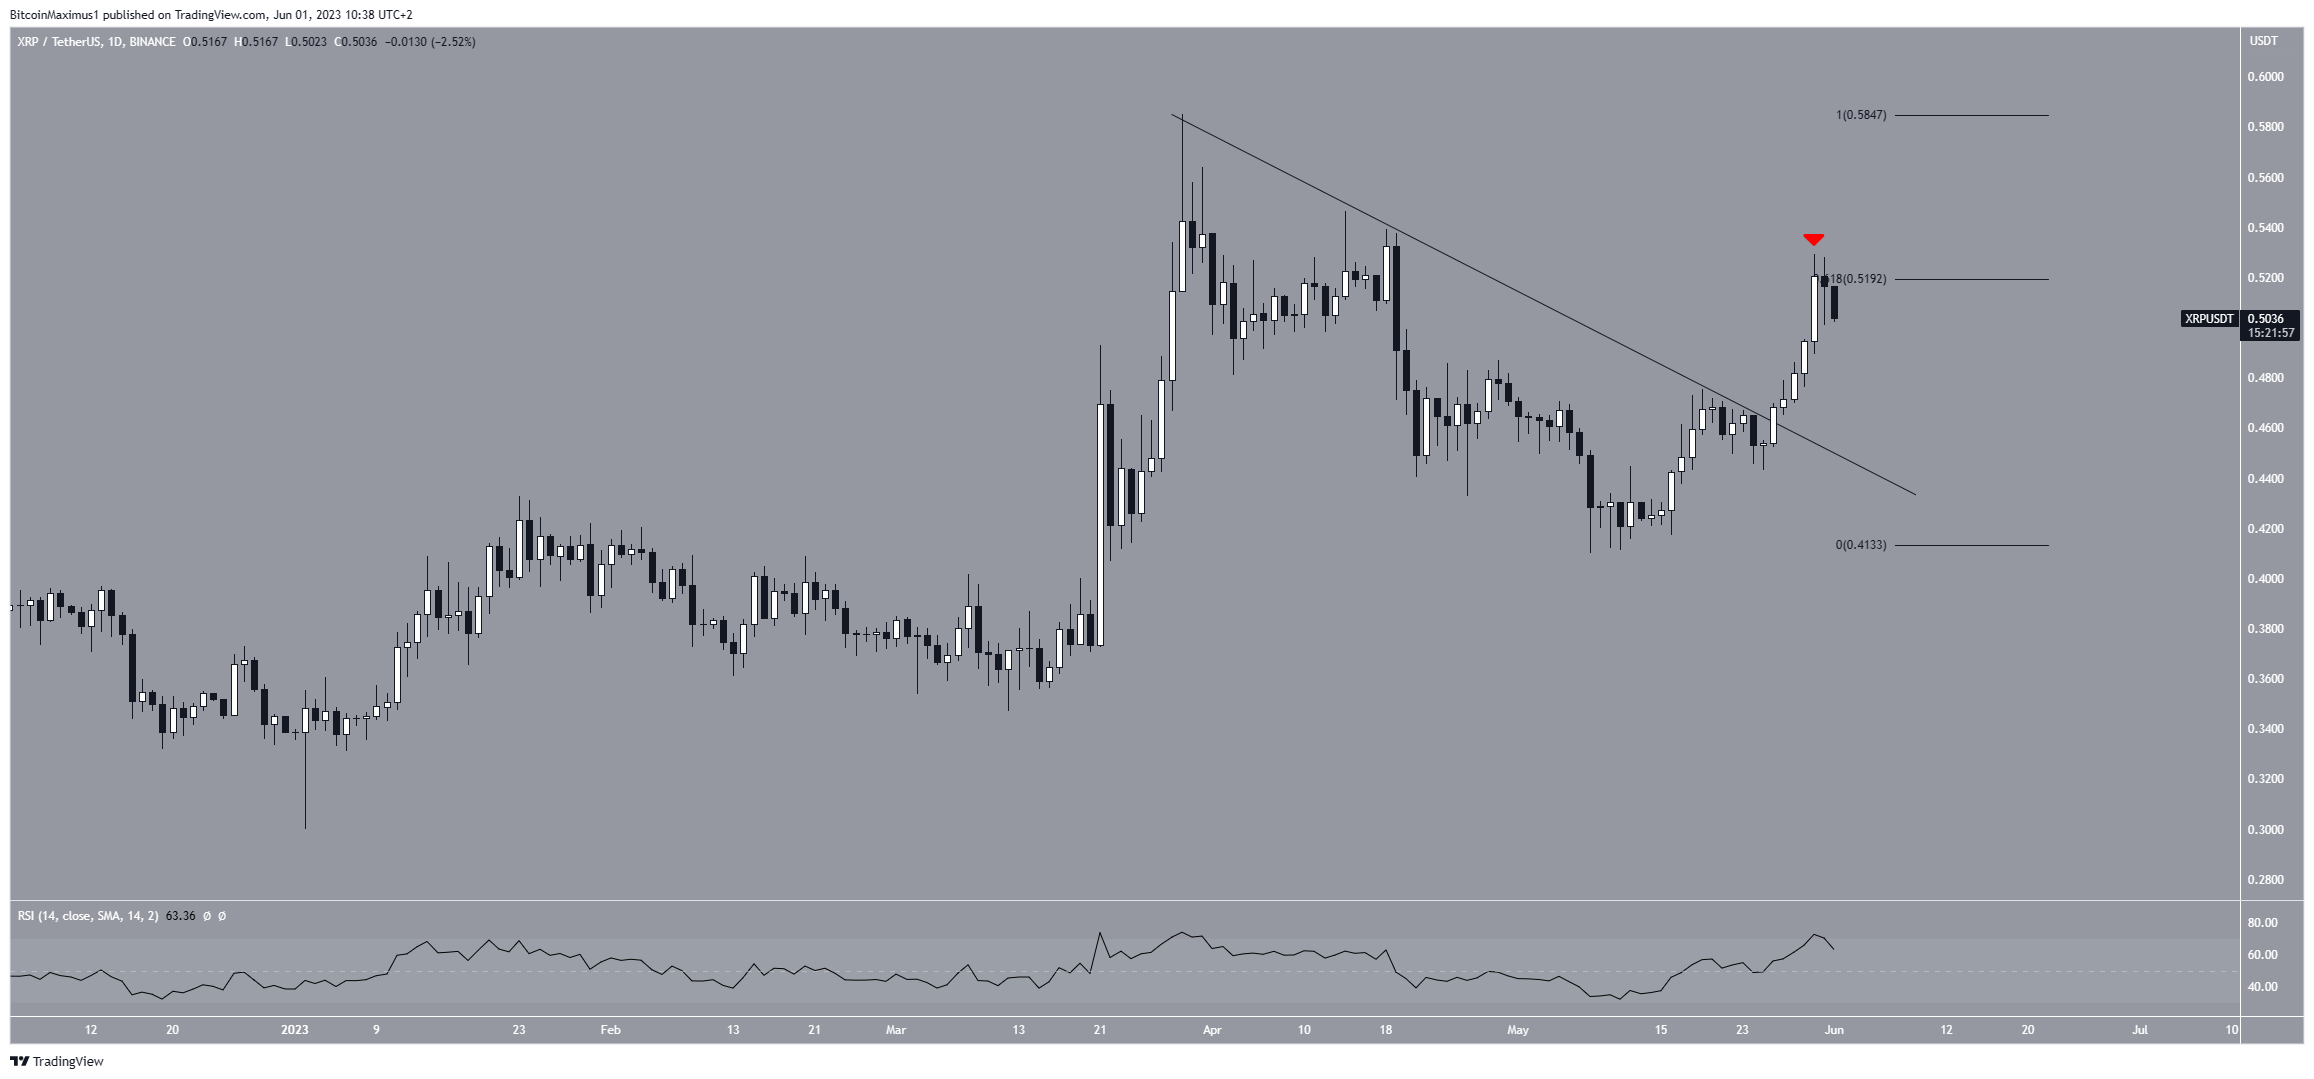
The Relative Strength Index (RSI) indicator supports the legitimacy of the breakout. By using the RSI as a momentum indicator, traders can determine whether a market is overbought or oversold and decide whether to accumulate or sell an asset.
RSI okuması 50'nin üzerindeyse ve trend yukarı yönlüyse, boğalar avantajlıdır, ancak okuma 50'nin altındaysa bunun tersi doğrudur.
However, while the indicator is above 50 and still increasing, it reached overbought territory. This is an area where local tops are often reached.
XRP Price Prediction: Has the Price Topped?
Based on a technical analysis within a short-term four-hour time frame, the ongoing rebound in XRP is merely a temporary rally and will be followed by another decline. This analysis suggests a bearish forecast for XRP’s price, which has possibly reached its local top.
The primary justification for this outlook is the wave count, which strengthens the notion of a downward trend. Technical analysts employ the Elliott Wave theory to determine the direction of trends by examining recurring long-term price patterns and investor psychology.
According to the wave count, the price of XRP has concluded a five-wave decline (indicated in black). This confirms a bearish trend. Furthermore, the decline followed an upward corrective labeled as A-B-C, further supporting this possibility.
If this long-term count is correct, the breakout from the descending resistance line is only part of another A-B-C correction. The 0.618 Fib retracement level rejecting the price supports this possibility.
So, the count suggests that a local top is in and a decrease to $0.34 will follow.
Salınımı 500 milyon XRP jetonu today supports this possibility. A release of this magnitude could create massive selling pressure, in turn causing a sharp downward movement.
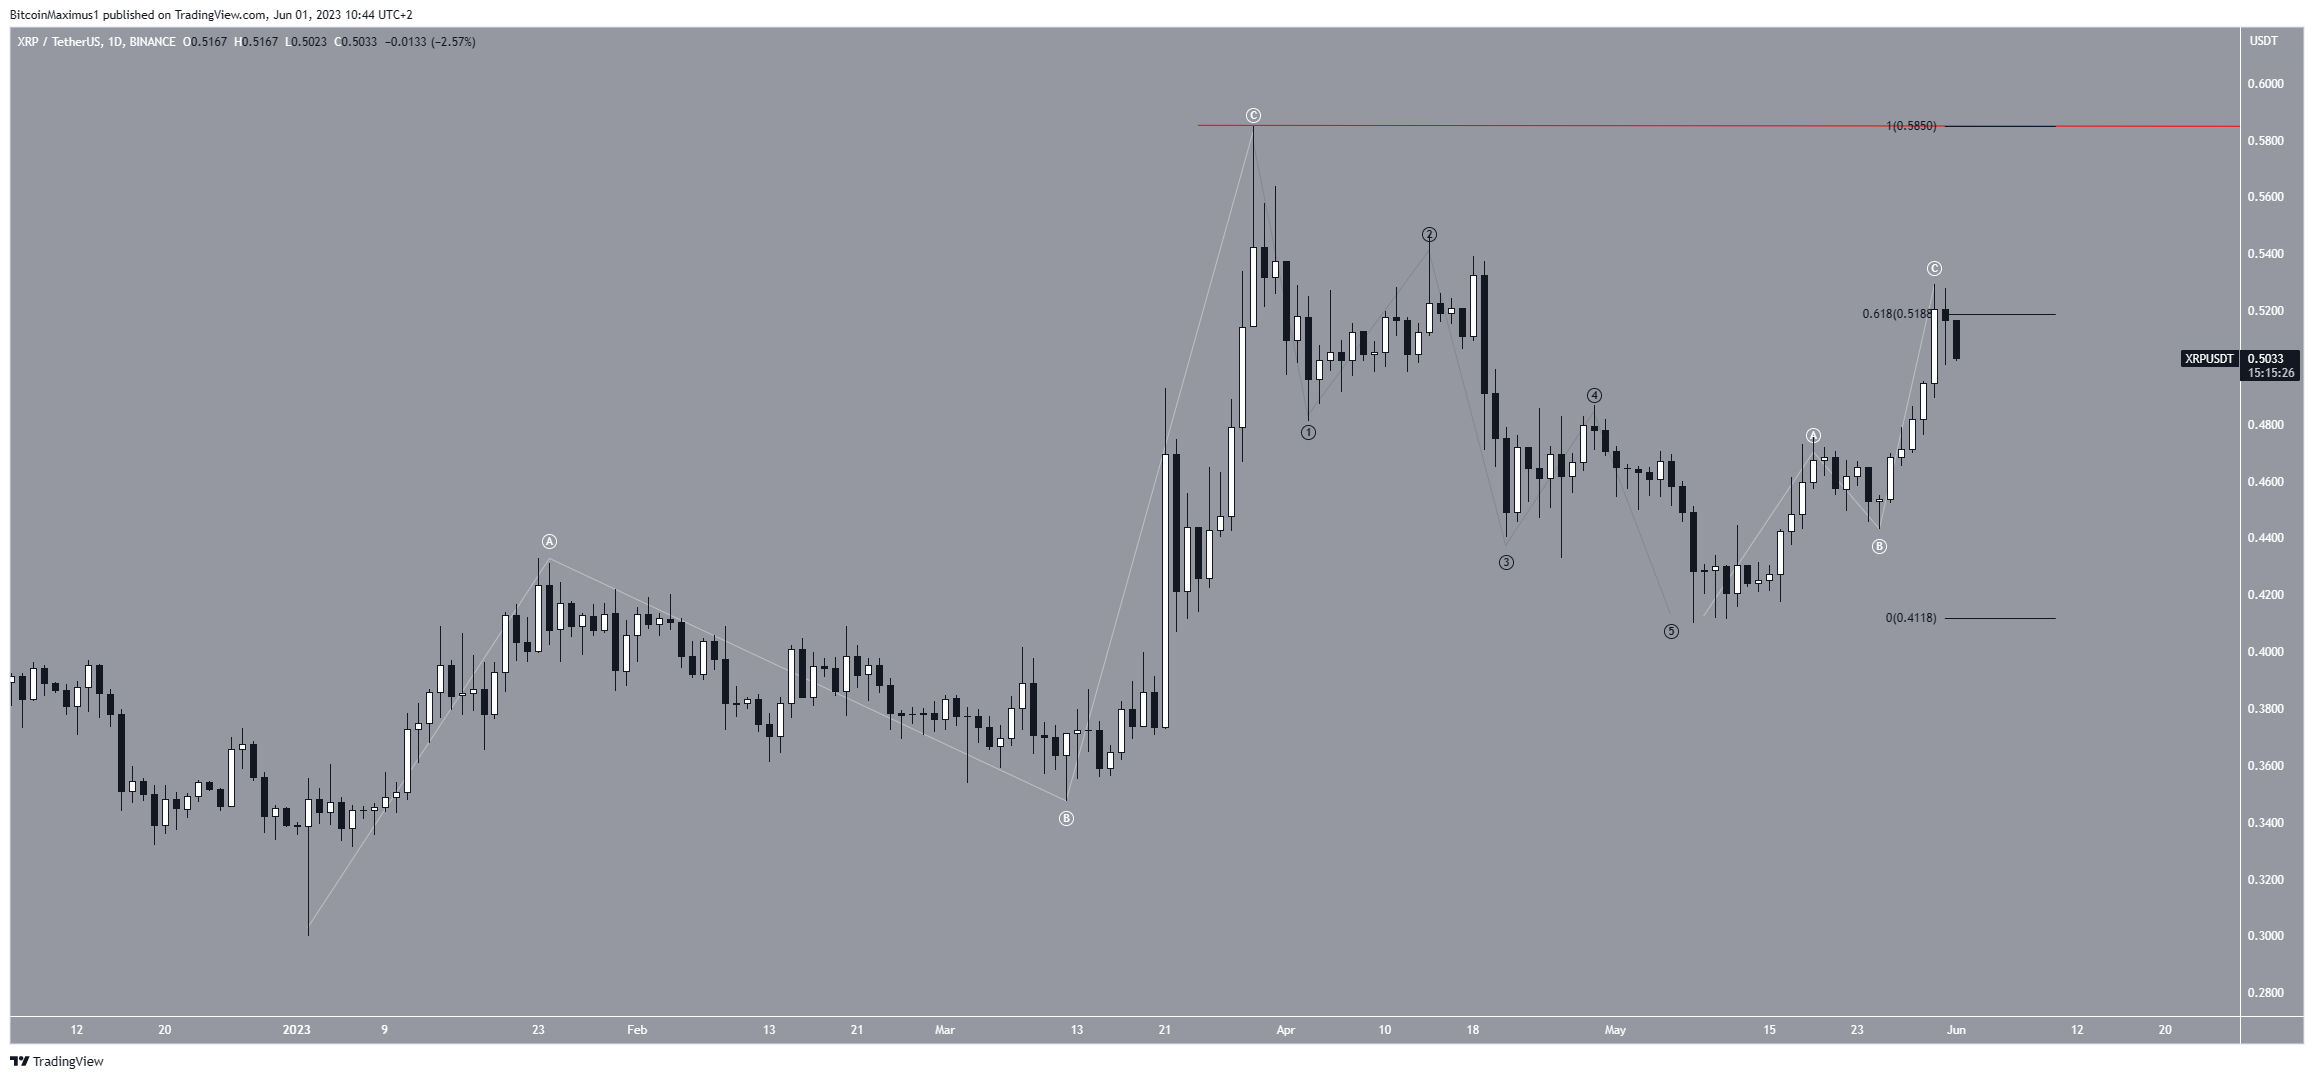
Despite this bearish XRP price prediction, an increase above the yearly high of $0.58 will mean the trend is still bullish. In that case, the XRP price could increase to the next resistance at $0.90.
BeInCrypto'nun en son kripto piyasası analizi için burayı tıklayın
Feragatname
Güven Projesi yönergelerine uygun olarak, bu fiyat analizi makalesi yalnızca bilgilendirme amaçlıdır ve finansal veya yatırım tavsiyesi olarak değerlendirilmemelidir. BeInCrypto doğru ve tarafsız raporlamayı taahhüt eder, ancak piyasa koşulları haber verilmeksizin değiştirilebilir. Herhangi bir mali karar vermeden önce daima kendi araştırmanızı yapın ve bir profesyonele danışın.
Source: https://beincrypto.com/xrp-price-steady-250m-escrow-release/