The cryptocurrency market is still in a state of uncertainty and fear. Ethereum is no exception, and any upward attempt is faced with immediate sell pressure. Will the bulls be able to regain control of the market?
Teknik Analiz
By Bozayı
Günlük Grafik
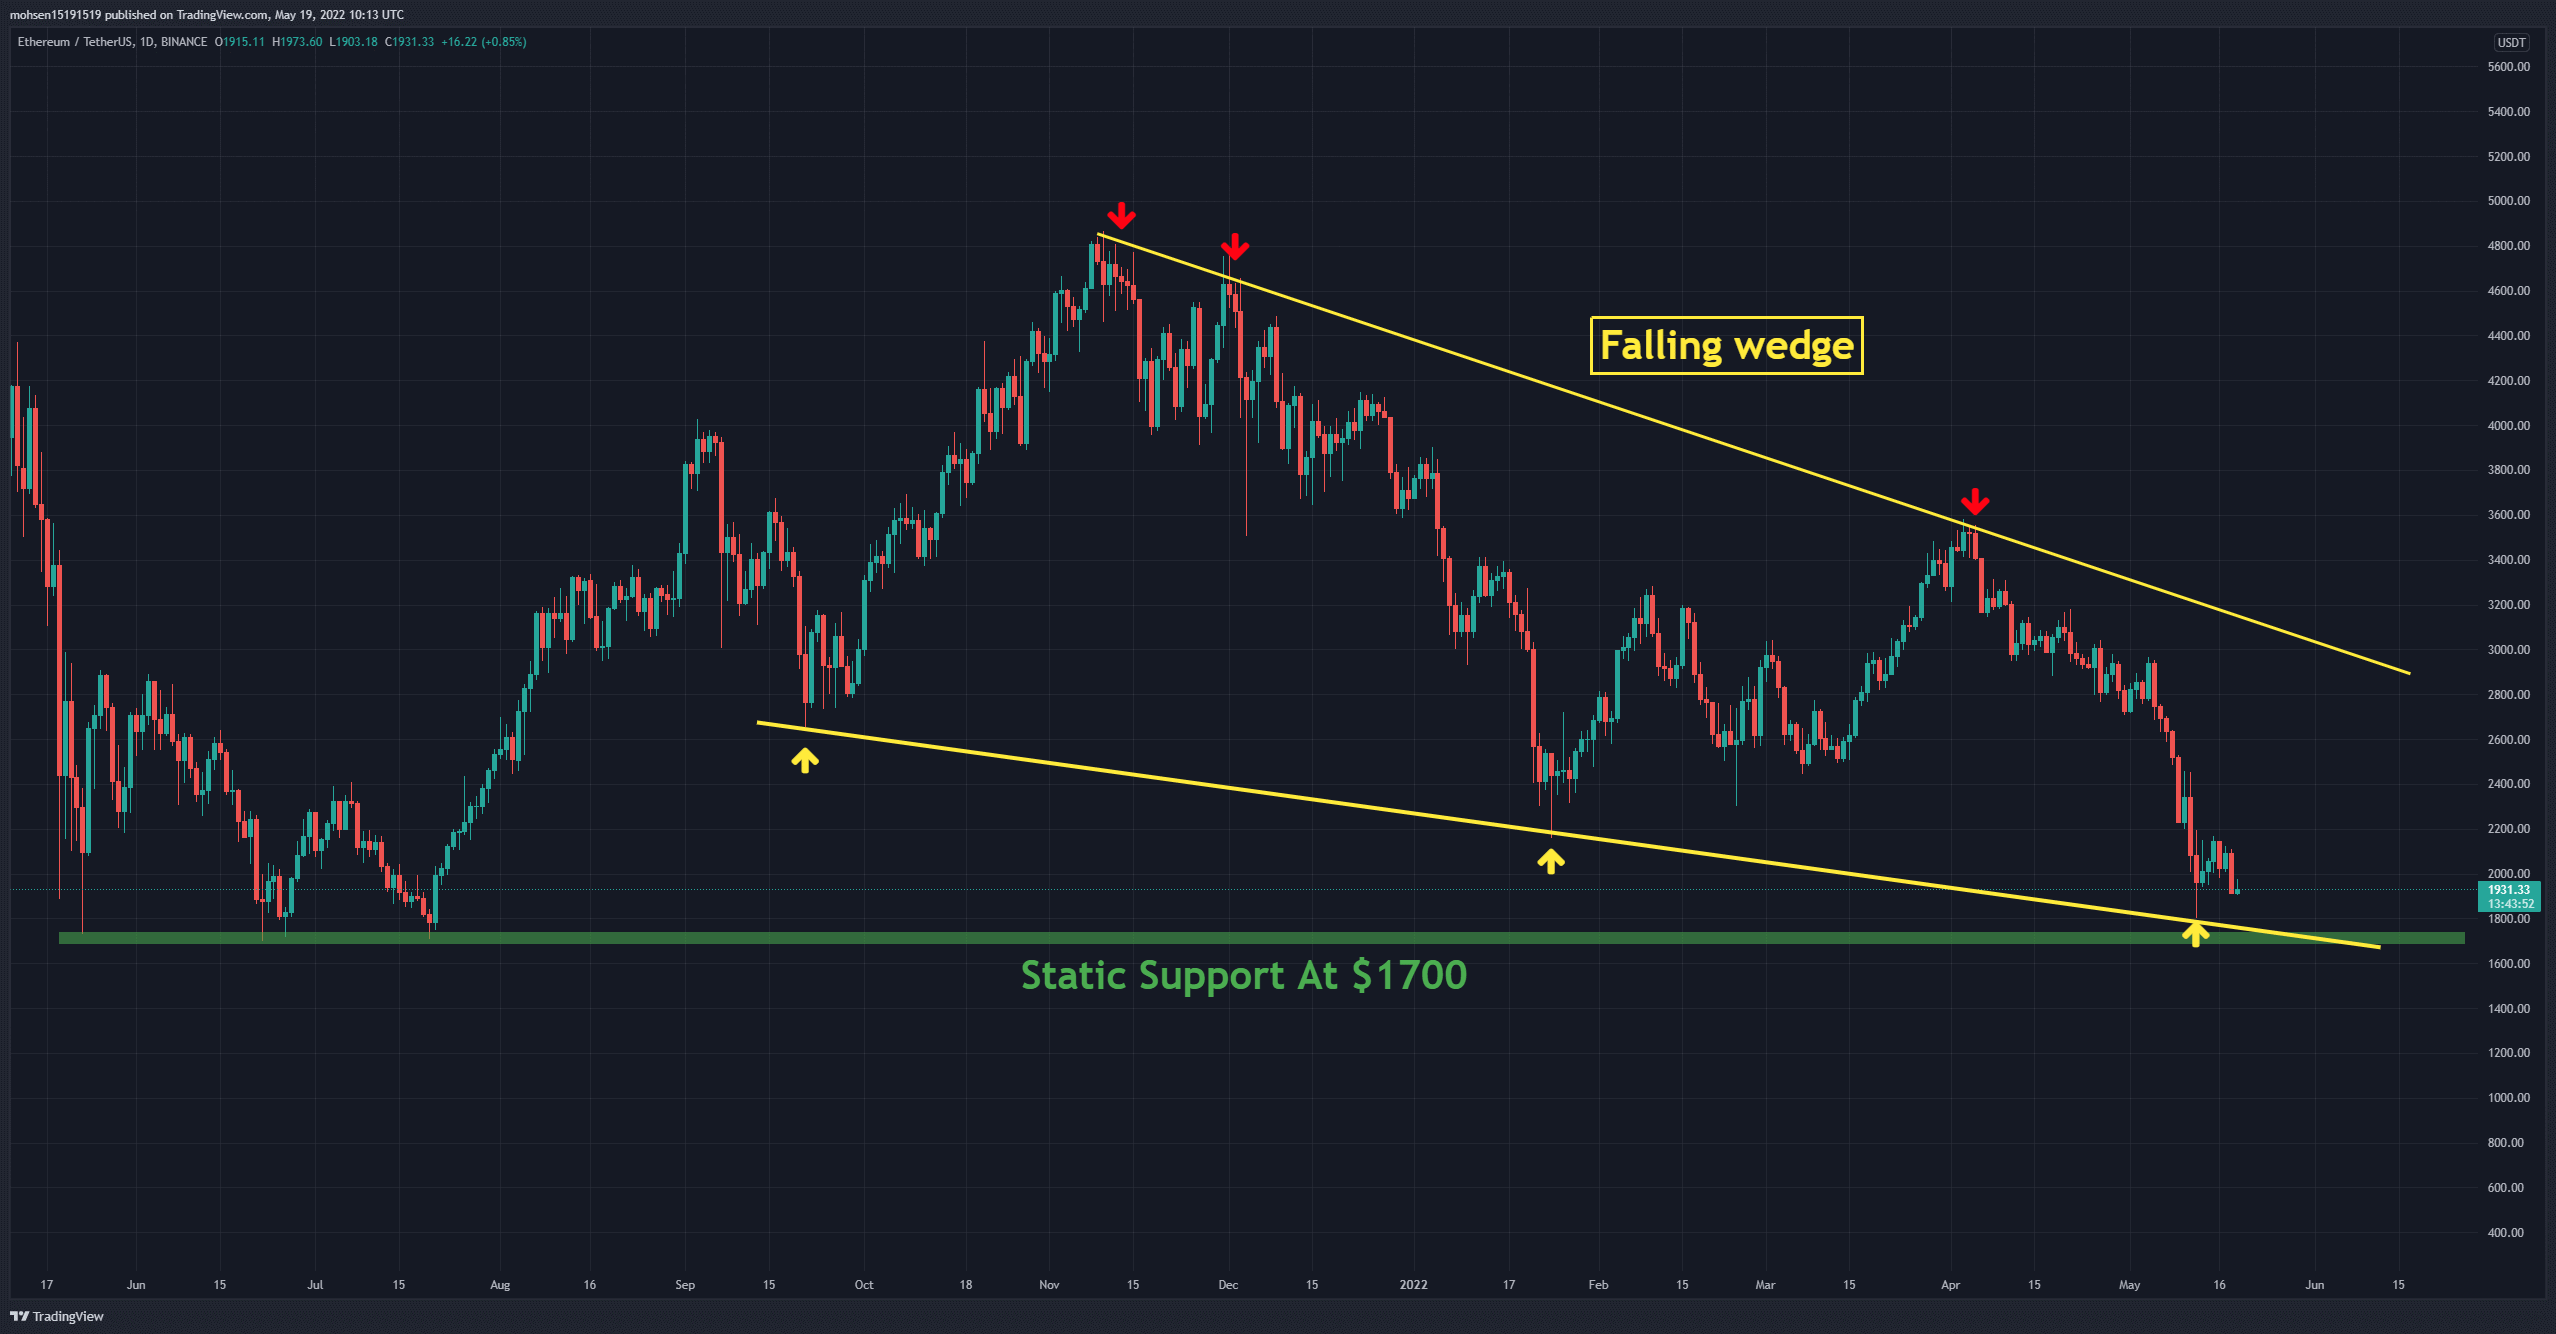
On the daily time frame, ETH is moving downward inside a falling wedge (in yellow). It is important to note that this wedge bottom is aligned with the horizontal support level of $1700 (in green), which can be a potential trend reversal point.
As a result, if the bulls can defend the green zone, the price will be more likely to move towards the static resistance at $2450. On the other hand, if the bears continue to suppress the market and break below the green support zone, the price is more likely to enter an extended regression phase.
Temel Destek Seviyeleri: 1700 ABD Doları ve 1500 ABD Doları
Anahtar Direnç Seviyeleri: 2200 ABD Doları ve 2450 ABD Doları
Hareketli ortalamalar:
MA20: 2376 $
MA50: 2818 $
MA100: 2835 $
MA200: 3301 $
ETH/BTC Grafiği
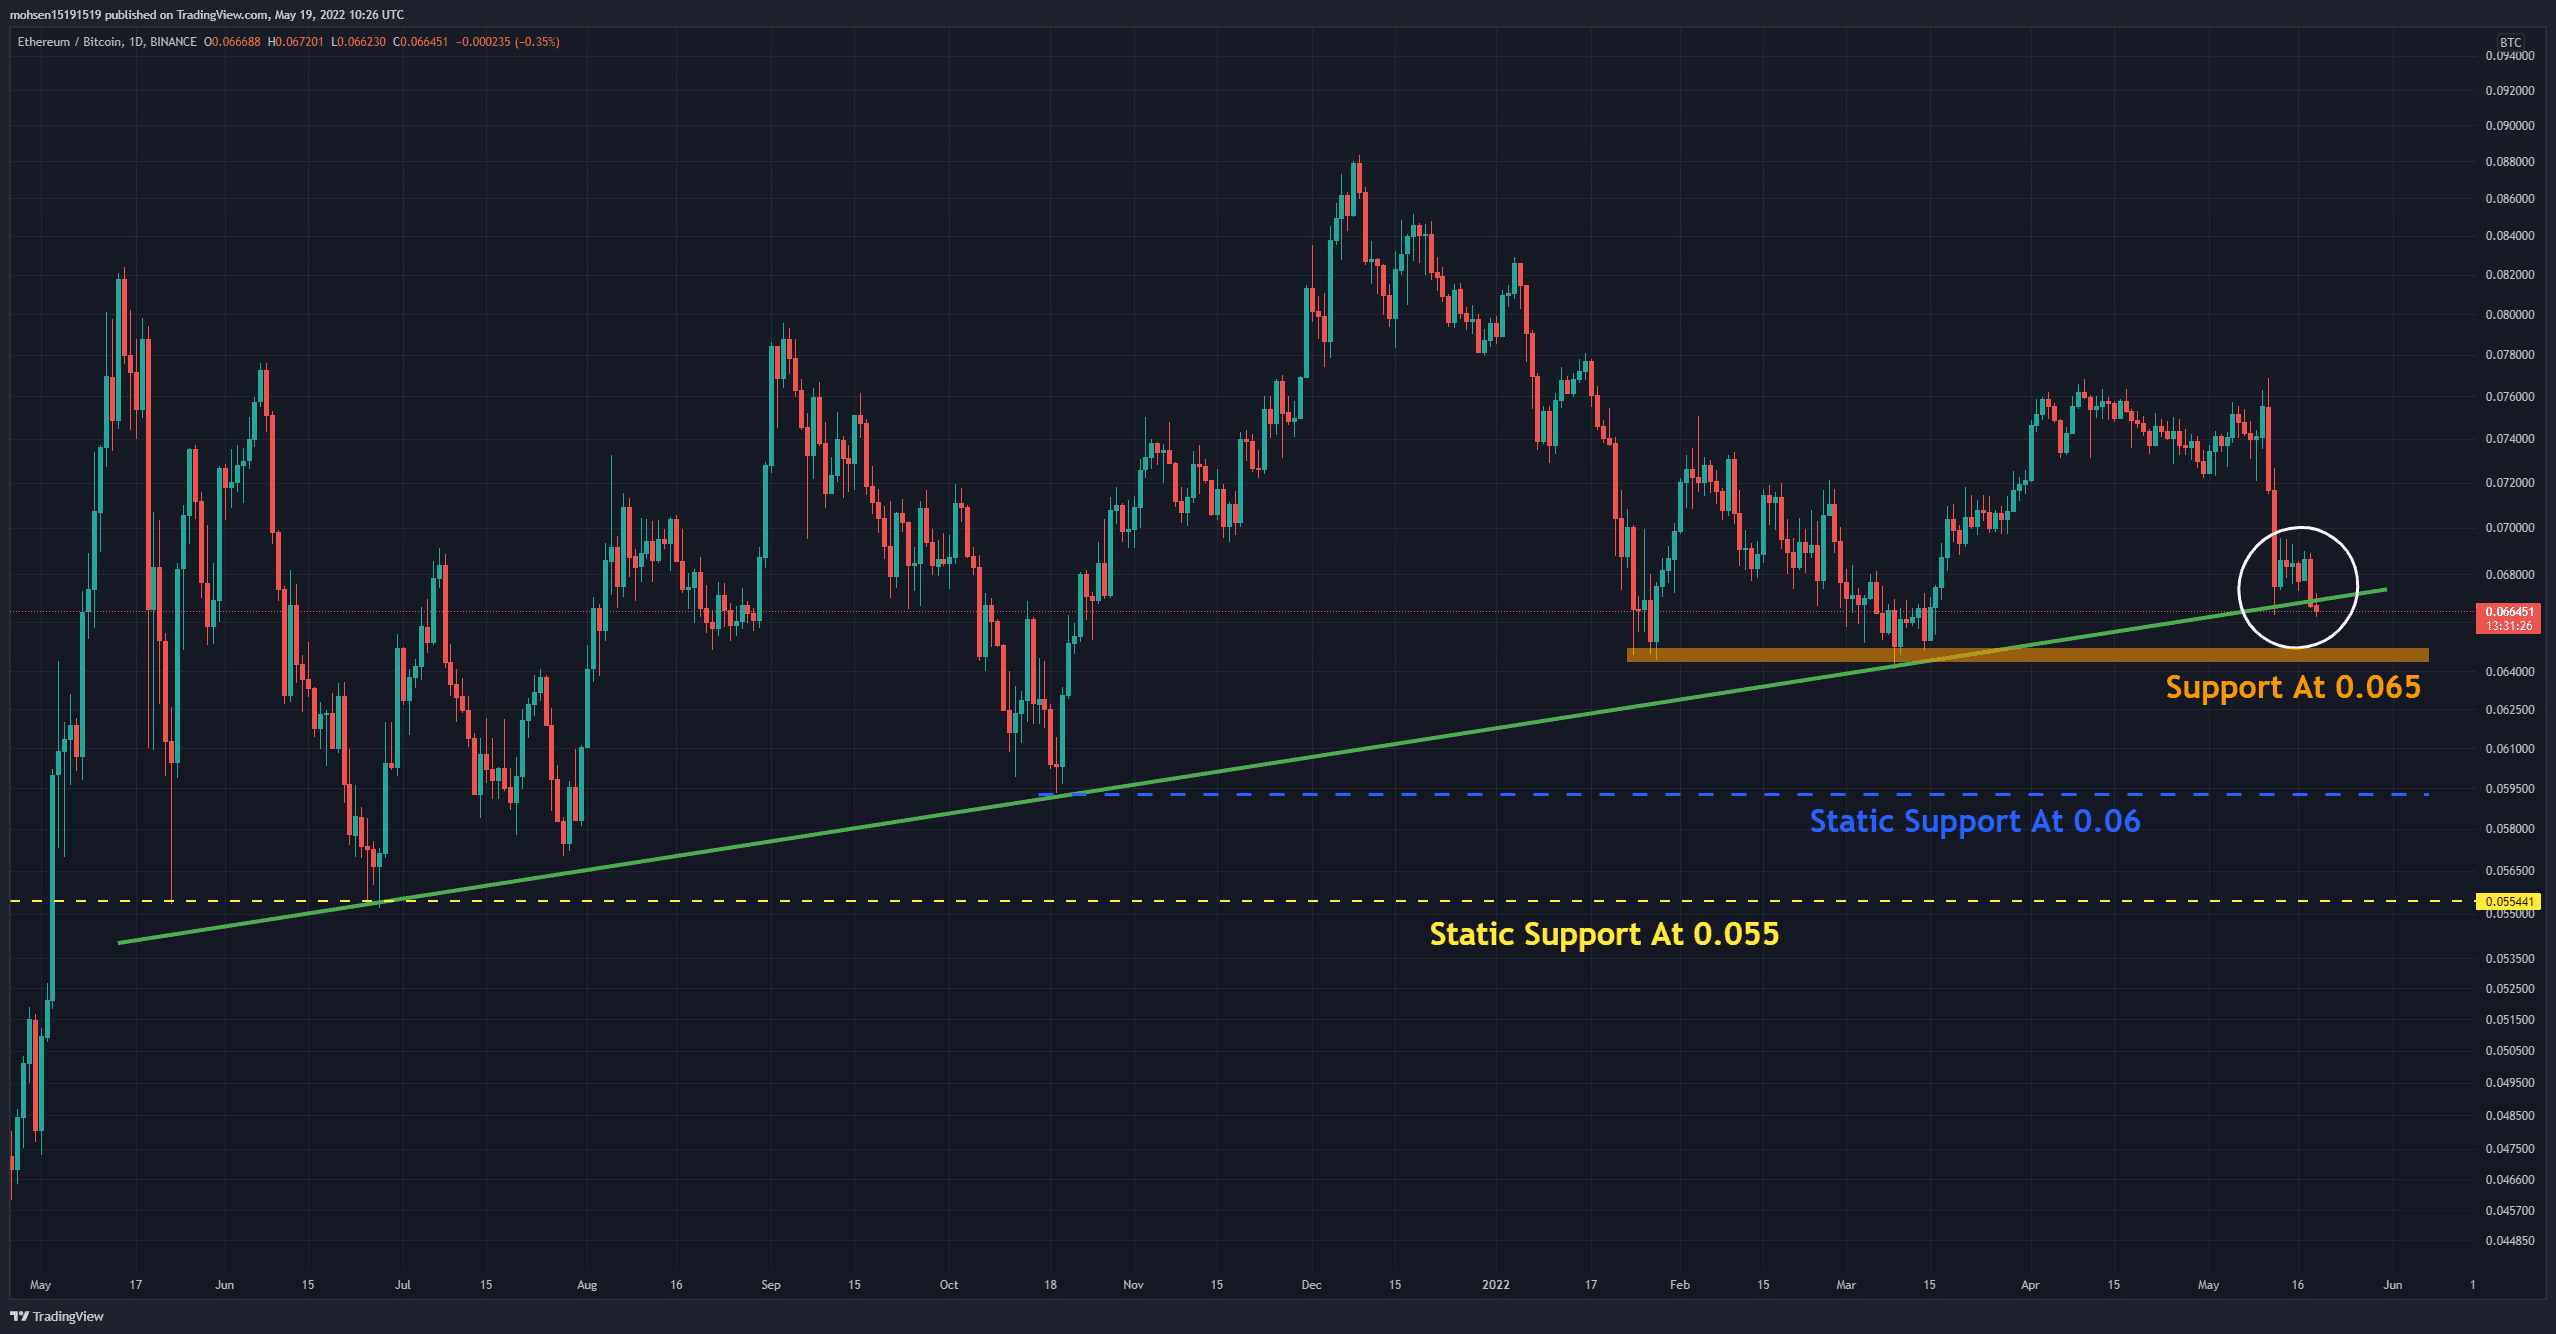
Against Bitcoin, ETH is trading on dynamic support (in green) that has prevented further drops in price four times in the past. The main concern is that the bears have managed to make an unconfirmed break and appear to be in control of the situation. On the other hand, horizontal support at 0.065 (in orange) can also be considered a level to withstand the increasing bearish momentum.
If the BTC price breaks below a major static level, the entire altcoin market is historically proven to follow with an amplified correction.
Temel Destek Seviyeleri: 0.065 BTC & 0.06 BTC
Anahtar Direnç Seviyeleri: 0.07 BTC & 0.072 BTC
Zincir Üzerinde Analiz
Tahmini Kaldıraç Oranı
Tanım: The exchange’s open interest is divided by their coins reserve, which shows how much leverage traders use on average. Increasing values indicate more investors are taking high leverage risk in the derivatives trade.
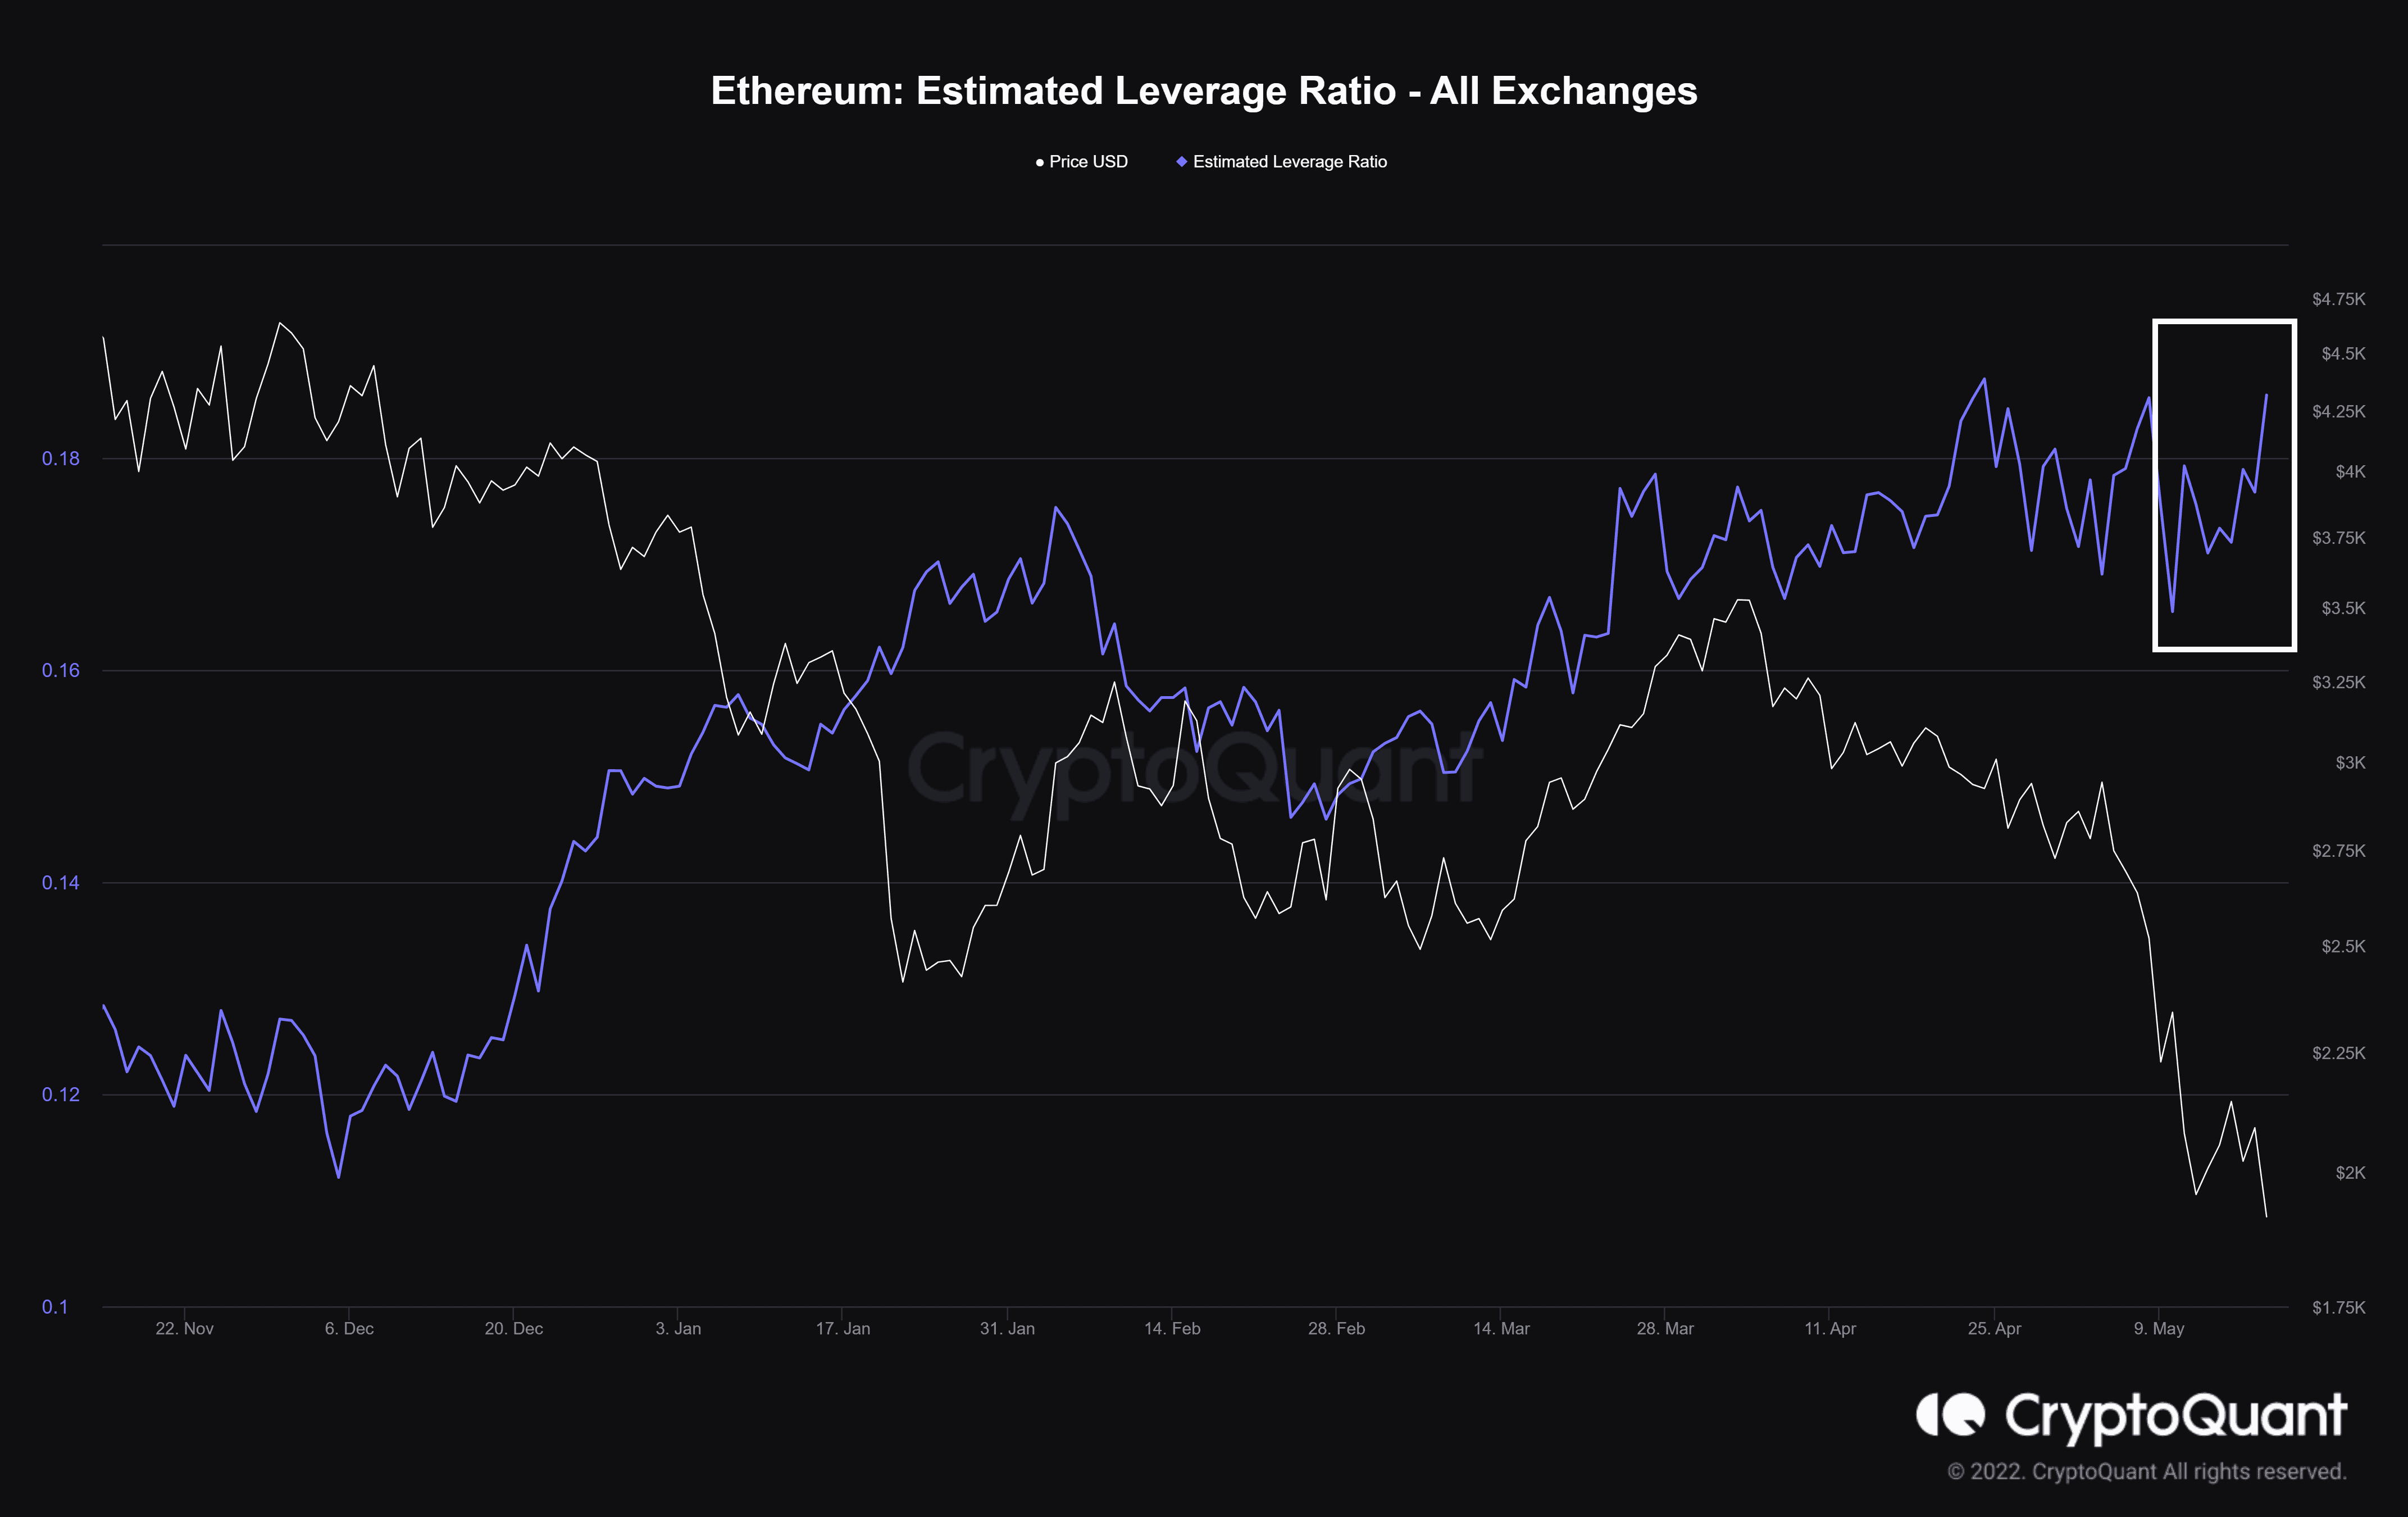
On the chart, one can see that this metric has started moving upwards again, indicating that investors are taking more risks. The consequent outcome is probably significant volatility and then a cascade of liquidations. After all, throughout a bearish phase, a de-leveraging phase has frequently led to a bullish trend in the market.
Binance Ücretsiz 100$ (Özel): Bu bağlantıyı kullan kayıt olmak ve ilk ay Binance Vadeli İşlemlerinde 100$ ücretsiz ve %10 indirimli ücret almak için (şartlar).
PrimeXBT Özel Teklifi: Bu bağlantıyı kullan Kaydolmak ve depozitolarınızdan 50$'a kadar almak için POTATO7,000 kodunu girmek için.
Feragatname: CryptoPotato'da bulunan bilgiler alıntılanan yazarlara aittir. CryptoPotato'nun herhangi bir yatırım alıp satmayacağı veya satmayacağı hakkındaki görüşlerini temsil etmez. Herhangi bir yatırım kararı vermeden önce kendi araştırmanızı yapmanız tavsiye edilir. Verilen bilgileri kullanmak kendi sorumluluğunuzdadır. Daha fazla bilgi için Sorumluluk Reddi Beyanı'na bakın.
Kripto para grafikleri TradingView tarafından.
Source: https://cryptopotato.com/eth-price-analysis-warning-signs-for-ethereum-as-bears-push-below-2000/